
This piece is about Manhattan brownstones as a housing type: where the remaining rows concentrate, and how neighborhood and physical attributes actually move value. Brooklyn brownstone belts (Park Slope, Brooklyn Heights, and the rest) are out of scope. It is not a repeat of the firm’s earlier methodology note on how to appraise a Manhattan townhouse versus condos and co-ops, and it is not a substitute for the 2026 neighborhood market snapshots of the West Village, Greenwich Village, Chelsea, or the Upper East Side. Borough context sits in the August 26 Manhattan housing market update.
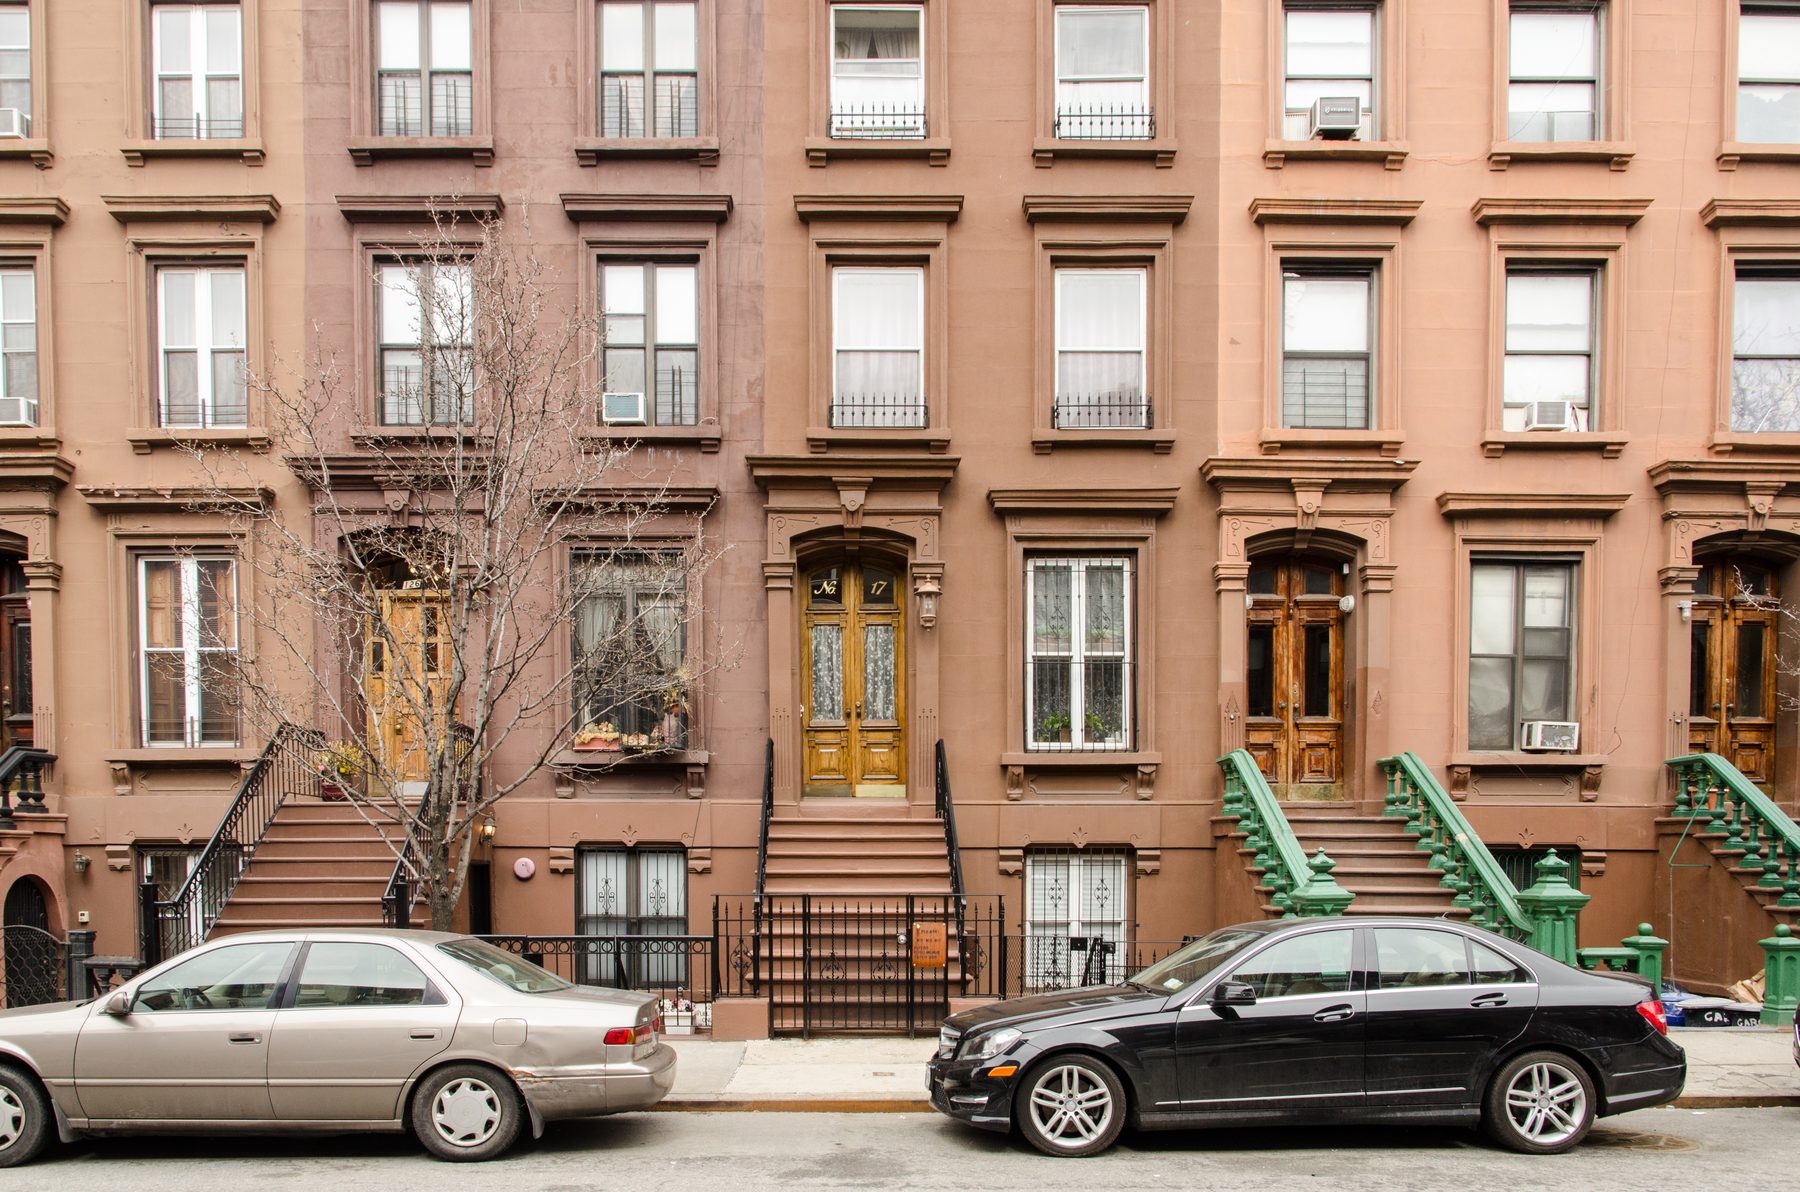
A brownstone is not a synonym for every Manhattan townhouse. In New York usage it is a row house whose street facade is clad in brown sandstone — typically a thin facing over brick masonry — rather than limestone, brick, or later reconstituted stone. Most surviving Manhattan examples are four or five stories counting the garden level, on lots commonly 15 to 25 feet wide and 40 to 55 feet deep. They were built as single-family dwellings; a large share were later converted to two- and three-family use, cooperatives, or mixed legal occupancy. That conversion history is a value driver. So is the stone itself: Portland Formation sandstone from the Connecticut Valley was widely used as a facing; when the bedding planes were set vertically (“face-bedded”), water entered the laminations and the facing spalled. Repair and replacement of brownstone facing and stoops is a real cost, not a cosmetic footnote, especially inside Landmarks Preservation Commission historic districts.
In this briefing, price, inventory, days on market, sale-to-list, and closed-sales volume are the only performance metrics used. Location is treated as site and housing-stock geography — block versus avenue, park-adjacent lot, landmark-district envelope, transit access as infrastructure — not as a ranking of the address.
Borough Tape: 1–3 Family / Townhouse in 2026
Townhouse prints disagree because the filters disagree: recorded closings versus signed contracts versus listing inventory; median versus average; 1–3 family versus a brokerage’s “townhouse” extract; one quarter versus the first half. The figures below were checked against the named source pages in late August 2026. Where two sources disagree, both are shown and the filter is named. A borough median is not a block-level time adjustment.
- Miller / Housing Notes, Manhattan 1–3 family, Q2 2026 (published July 2, 2026): Median sales price $6,100,000, up 28.4% year over year. Average sale size 5,019 square feet, up 14.7%. Average price per square foot up 18.1% — after the size jump, Housing Notes described the underlying PPSF move as a more modest roughly 4% gain. Listing inventory 291, down 39.9% year over year and 21.4% below the decade average of 370. Source: Housing Notes, 2Q26 Manhattan Sales Inventory Remains Lean.
- Douglas Elliman Pulse, Manhattan 1–3 family, Q2 2026: Recorded sales 66 (+7.0% year over year, +4.3% quarter over quarter); median $5.23 million; average $8.16 million; average PPSF $1,496; dollar volume $538.47 million. Signed contracts 52 (−26.8% year over year); median $6.42 million; average $9.60 million; average PPSF $1,665. New listings 139 (+1.4% year over year, +28.7% quarter over quarter); median $6.00 million; average $9.37 million; average PPSF $1,777. Recorded-sales share by Elliman submarket: Downtown West 30.2%, Upper Manhattan 28.6%, Upper East Side 25.4%, Upper West Side 9.5%, Downtown East 6.3%. New-listings share: Upper Manhattan 35.1%, Upper East Side 28.4%, Downtown West 19.4%, Midtown East 9.0%, Upper West Side 8.2%. Source: Douglas Elliman Pulse Q2 2026 Sales Report, Manhattan.
- Brown Harris Stevens, Manhattan 1–3 family townhouses, first half 2026 (Gregory Heym): 123 sales (122 in first-half 2025). Average price $8,329,405; median $5,564,257; average PPSF $1,481 (up 5% from $1,412). Average days on market 169 (down 18% from 205). Sale-to-list 93.50% of last asking price (93.10% a year earlier). Geographic split, first-half 2026 versus first-half 2025: East Side (generally 59th to 96th Street, Fifth Avenue to the East River) 30 sales, average $13,210,200, median $9,225,000, PPSF $1,763; West Side (generally 59th to 110th Street, Hudson River to west of Fifth) 15 sales, average $6,610,167, median $6,100,000, PPSF $1,407; Midtown (34th to 59th) 5 sales, average $6,790,000, median $6,500,000, PPSF $1,143; Downtown 34th to 14th Street 14 sales, average $5,828,589, median $5,707,129, PPSF $1,438; Downtown south of 14th Street 26 sales, average $13,035,962, median $8,000,000, PPSF $2,220; Upper Manhattan (generally north of 96th Street on the East Side and 110th Street on the West Side) 33 sales, average $2,259,789, median $2,100,000, PPSF $761. Source: BHS First Half 2026 Manhattan Townhouse Market Report.
- Leslie Garfield Manhattan townhouse, first half 2026 (published July 10, 2026): 116 closed sales, up 4.5% year over year; gross volume $1.2 billion, up 31.2%; average sale price $10.5 million, up 25.5%; average PPSF $1,613, up 10.2%. The write-up flags the $70,000,000 closing of 105–107 Bank Street in the West Village as a mix driver. Source: Leslie Garfield Manhattan Mid-Year Report 2026.
- The Real Deal Data, Manhattan 1–3 family, year-to-date through early July 2026 (published August 17, 2026): Borough median PPSF $1,553, up 20.4% versus full-year 2025. Upper West Side median PPSF $1,489, up 24% versus 2025 (the largest neighborhood increase on that table). West Village median PPSF $3,524, up 3.6% versus 2025 (the highest neighborhood PPSF on that table). Source: TRD Data, Manhattan vs. Brooklyn Townhouse Market, 2026.
- Corcoran First Quarter 2026 Manhattan Townhouse Report, as summarized May 7, 2026 by AREA Advisory: 47 closings, up 27% year over year; median $6.5 million, up 14%. Single-family median $7.3 million; multi-family (two-to-four-unit) median $5.5 million. East Side single-family: 17 closings, median $10.7 million, average $15.0 million, average PPSF $2,082. Downtown single-family: five closings, median $13.0 million, average $12.2 million, average PPSF $2,741. West Side single-family median $6.3 million on four closings. Uptown (above 96th Street east / 110th Street west) single-family PPSF $739 and multi-family PPSF $596, with most Uptown trades between $1.95 million and $3.83 million. Source: AREA / Corcoran Q1 2026 Manhattan Townhouse Report summary.
Read together: Miller’s Q2 median ($6.1 million) and Elliman’s Q2 recorded median ($5.23 million) are not a fight about the “right” townhouse price. They are different extracts on a 66-sale (Elliman) / mix-shifted (Miller size jump) sample. Garfield’s first-half average ($10.5 million) sits above BHS’s first-half average ($8.33 million) because trophy-width and double-frontage trades pull an average harder than a median — BHS’s first-half median was $5.56 million. TRD’s West Village $3,524 PPSF versus Upper Manhattan’s BHS $761 PPSF is the location split this post is about. Do not import any of those prints as a time adjustment for a 16-foot converted brownstone, or for a 25-foot single-family behind a limestone facade.
What a Manhattan Brownstone Actually Is
The word “brownstone” names the facing stone, not the legal occupancy. The stone is an arkosic sandstone. The Portland Brownstone Quarries on the Connecticut River were a primary source for the New York facing used so widely in the second half of the nineteenth century that the building type took the stone’s name. NPS’s National Historic Landmark documentation for those quarries records that the material was used as a facing on urban row houses, not as solid-stone walls. Geological Society of Connecticut field notes add the construction failure mode that still shows up in 2026 inspection files: high demand led to unseasoned stone and to veneers set with bedding planes vertical, so water entered the laminations and the facing peeled. Sources: NPS NHL nomination, Portland Brownstone Quarries; Geological Society of Connecticut, Traprock, Tracks, and Brownstone.
LPC staff guidance treats brownstone as sandstone that is “very susceptible to deterioration” and often in need of repair. Resurfacing of large areas is a staff-issuable permit only when the historic stone is in extremely poor condition; stoops and bases are more commonly patched or partially resurfaced. Under Title 63 RCNY §2-11, replacement of brownstone may be in-kind at primary facades, or cast stone may be used for facade elements; stoops and areaway walls may use cast stone or stucco over backup masonry — except that stucco over backup masonry is not permitted at Individual Landmarks. Those rules are cost, time, and exterior-utility constraints. They are not a style preference. Sources: LPC Permit Guidebook, Chapter 1, Restoration; RCNY §2-11.
Limestone-fronted row houses, brick row houses, and later neo-Renaissance “American basement” townhouses are related building types. They are not the same facade, and they are not automatic comps for a sandstone-fronted brownstone of similar width. On the Upper East Side in particular, Park and Fifth corridors and many side-street mansions are limestone or brick, while remaining brownstone fronts persist on a thinner set of side streets. The market prices the facing, the stoop, and the legal use separately from the word “townhouse” on a listing.
Where the Rows Still Concentrate
Manhattan’s early brownstone belt (roughly 1835–1875) was laid down from today’s Greenwich Village and Chelsea through what became Midtown, and on the East Side from the East Village through East Harlem. The Midtown “brownstone district” was largely replaced by commercial construction; surviving early rows are densest in Greenwich Village, with smaller cohorts in Chelsea and on remaining East Side side streets. Late brownstones (roughly 1875–1905) — Queen Anne, Romanesque Revival, and Renaissance Revival groups, often with bays, gables, and mixed brick-and-stone fronts — were built in volume on the Upper West Side and in Harlem, Hamilton Heights, and Carnegie Hill. Speculative one-family row construction in Manhattan effectively ended after the 1907 financial panic. That geography is housing stock, not a ranking of neighborhoods. Source for the early/late distribution and typical 15–25 foot widths: Buildings of New York, Chapter 2 (Victorian brownstones).
Current transaction geography still tracks that stock. On Elliman’s Q2 2026 recorded 1–3 family tape, Downtown West, Upper Manhattan, and the Upper East Side together were 84.2% of 66 closings. BHS’s first-half 2026 townhouse table puts the most sales in Upper Manhattan (33) and Downtown south of 14th Street (26), with the East Side next (30) — and a PPSF span from $761 in Upper Manhattan to $2,220 south of 14th Street. Thin sale sets are the rule. A 33-sale Upper Manhattan half-year is not a block absorption rate.
Much of that stock sits in designated historic districts. Greenwich Village Historic District (LP-0489) was designated April 29, 1969. Chelsea Historic District (LP-0666) was designated September 15, 1970. Gramercy Park Historic District is a mid-nineteenth-century row around the park. Hamilton Heights Historic District was designated November 26, 1974, with an extension March 28, 2000; Hamilton Heights/Sugar Hill and its extensions cover additional row groups. Mount Morris Park Historic District was designated November 3, 1971. Upper West Side/Central Park West and Riverside–West End districts cover large late-brownstone tracts. LPC maps, not listing copy, control whether a facade, stoop, cornice, or window is a permit item. Sources: LPC Greenwich Village HD map; Chelsea HD designation report; LPC Hamilton Heights / Sugar Hill maps.
West Village and Greenwich Village
Downtown south of 14th Street is the high-PPSF end of the 2026 townhouse tape. BHS first-half 2026: 26 sales, median $8,000,000, average $13,035,962, PPSF $2,220. TRD Data’s year-to-date West Village townhouse median PPSF was $3,524. Corcoran’s Q1 downtown single-family average PPSF was $2,741 on five closings, with 7 MacDougal Alley in Greenwich Village reported at $4,500 per square foot and 78 Morton Street in the West Village at $19 million. Leslie Garfield’s first-half average is pulled by 105–107 Bank Street at $70 million. Those are mix and width events on a thin sample. They do not measure a 16-foot converted row house two blocks off.
The Village stock is early brownstone and related rowhouse fabric inside the Greenwich Village Historic District and its extensions: high stoops, brick or sandstone fronts, narrow lots, and rear-yard gardens whose utility depends on lot depth, legal rear-yard coverage, and light. West Village and Greenwich Village are adjacent competitive sets, not substitutes. A Bank Street double-wide single-family closing does not support a MacDougal Street multi-family without width, legal-use, and location adjustments the market actually makes. Condo and co-op medians for the West Village on mixed-tenure portals are omitted here as brownstone indications — they blend stacked product with 1–3 family stock.
Chelsea and Gramercy
Chelsea and Gramercy hold remaining early brownstone and brick-row groups inside their historic districts. They are not the volume centers of the 2026 1–3 family tape. Elliman’s Q2 recorded-sales share for Midtown East was not broken out as a closing percentage on the recorded-sales table (Downtown East was 6.3%); BHS Midtown (34th to 59th) printed five first-half sales. Downtown 14th-to-34th Street — the band that includes Chelsea and Gramercy Park’s north edge — printed 14 BHS first-half sales at a $5,707,129 median and $1,438 PPSF, well below downtown-south-of-14th. That is a location and mix split, not a quality ranking of Chelsea versus the Village.
A separately sourced 2026 Chelsea-only or Gramercy-only closed townhouse median was not on the pages checked. Do not invent one from mixed-tenure listing medians. Comps stay inside the district, the width band, and the legal occupancy. A Gramercy Park-facing lot is a site factor (park-adjacent frontage, orientation, and any private-park rights that actually transfer). It is not a ranking of the block, and it does not import a West Village PPSF.
Upper West Side Brownstone Belts
The Upper West Side is the largest remaining late-brownstone district in Manhattan: side-street rows between Central Park West and Riverside Drive, especially in the 70s, 80s, and 90s, inside the Upper West Side/Central Park West and Riverside–West End historic districts. TRD Data’s year-to-date UWS townhouse median PPSF was $1,489, up 24% versus full-year 2025 — the largest neighborhood PPSF increase on that Manhattan table, and still far below the West Village’s $3,524. BHS’s broader West Side map (59th to 110th) printed 15 first-half 2026 sales, median $6,100,000, PPSF $1,407. Elliman’s Q2 recorded-sales share for the Upper West Side was 9.5% of a 66-sale sample — thin volume, not thin stock.
Location inside the UWS is block geography. Central Park West–adjacent and Riverside Drive–adjacent lots are site factors (frontage, exposure, park-adjacent orientation). Mid-block lots between Columbus and Amsterdam are a different comparable set from a park-fronting row. Avenue buildings are often later elevator apartments, not brownstone comps. Width still matters: a 20-foot single-family with a functioning rear garden is not a 16-foot two-family with a paved areaway. Landmark-district limits on stoop restoration, window replacement, and rooftop additions are cost and utility items on this stock.
Upper East Side: Limestone, Brownstone, and Townhouse
The Upper East Side remains a large 1–3 family market by dollar volume, but much of the high-PPSF stock is limestone or brick mansion-row, not sandstone-fronted brownstone. BHS East Side first-half 2026: 30 sales, median $9,225,000, average $13,210,200, PPSF $1,763. Corcoran Q1 East Side single-family: 17 closings, median $10.7 million, average PPSF $2,082. Elliman Q2 recorded-sales share 25.4%. Those prints mix limestone, brick, and remaining brownstone fronts. A Park or Fifth limestone single-family is not an indication for a 16-foot brownstone east of Lexington without a location, width, and facade-type adjustment.
Carnegie Hill retains late brownstone groups; Lenox Hill retains both early brownstones (many altered into customized townhouses) and later limestone. Yorkville’s remaining row stock sits in a different asking-price band on mixed-tenure listing tables and is a different competitive set. The firm’s August 27 Upper East Side snapshot covers co-op/condo/townhouse splits; this post only adds the facade-type distinction the townhouse median conceals.
Harlem, Hamilton Heights, and Sugar Hill
Upper Manhattan is where a large share of surviving late brownstone rows still stand — Mount Morris Park, the side streets off Lenox and Adam Clayton Powell Jr. Boulevard, Strivers’ Row / St. Nicholas Historic District, Hamilton Heights, and Sugar Hill — and where 2026 townhouse volume is concentrated at a different price band. BHS first-half 2026: 33 sales, the largest geographic count on that table, median $2,100,000, average $2,259,789, PPSF $761. Elliman Q2 recorded-sales share 28.6%; new-listings share 35.1%, the largest listing share on that 1–3 family table. Corcoran Q1 Uptown single-family PPSF $739 and multi-family PPSF $596, with most trades between $1.95 million and $3.83 million.
$761 PPSF (BHS Upper Manhattan) versus $2,220 PPSF (BHS downtown south of 14th) versus $3,524 PPSF (TRD West Village) is a location and housing-stock split on the same building type. It is not a statement about who lives where, and it is not a reason to import a Village closing into a Hamilton Heights file. Legal use is the other split: many Harlem and Hamilton Heights rows remain two- and three-family with garden-level units; some still include rent-regulated tenancies. Certificate of occupancy, remaining regulated units, and whether the building can legally be returned to single-family use are appraisal problems. They do not collapse into a $2.1 million regional median.
Facade and stoop condition is a larger share of the value discussion on this stock than on a recently resurfaced Village single-family. Deferred brownstone patching, stoop reconstruction, and cornice work inside Hamilton Heights/Sugar Hill or Mount Morris Park historic districts are LPC-constrained costs. Original detail versus a prior gut that removed parlor-floor millwork is a quality rating, not a marketing label.
How Location and Property-Type Splits Move Value
The 2026 tape supports several appraisal adjustments as market splits. It does not publish a reliable dollar premium for each one. Where a source does not quantify the increment, the increment is omitted rather than invented.
- Neighborhood and block versus avenue. BHS first-half PPSF already spans $761 (Upper Manhattan) to $2,220 (downtown south of 14th). TRD adds a West Village townhouse PPSF of $3,524 and an UWS PPSF of $1,489. Inside a neighborhood, park-adjacent and mid-block lots are different sites. Avenue frontage on a former row block is often a different improvement (later apartment house) and a different external-influence set (traffic, commercial overlay). Location adjustments have to come from matched 1–3 family sales, not from a stacked-condo PPSF on the same street.
- Width and depth. Typical Manhattan brownstone lots run about 15–25 feet wide; 18–20 feet is the common band, and 25-foot and double-frontage houses are a thinner competitive set (CityRealty’s townhouse briefing treats sub-18-foot as narrow and over-25-foot as a distinct, scarce set). Leslie Garfield’s mid-year note flagged “increasingly scarce double-wide residences.” Miller’s Q2 average sale size of 5,019 square feet, up 14.7%, is the current warning that headline medians are mix-driven. A 16-foot house and a 25-foot house of similar condition are not interchangeable. No verified 2026 dollar-per-foot-of-width premium is used here. Sources: CityRealty townhouse briefing; Fontan Architecture on 25-foot townhouses.
- Single-family versus converted multi-family / legal use. Corcoran Q1: single-family median $7.3 million versus multi-family median $5.5 million on the same townhouse report. Remaining rent-regulated units, a C of O that does not match the marketed unit count, and FAR that cannot be used because of landmark or zoning constraints are legal-use and highest-and-best-use issues. They are not “upside” until the market and the Department of Buildings agree. Unadjusted condo or co-op comps cannot prove a conversion residual.
- Original detail versus gut renovation versus deferred facade and stoop work. AREA’s Q1 read (citing Corcoran) is directional: renovated single-family product led the quarter; properties that need significant work were discounted. That is a condition/quality split. Sandstone facing and stoop reconstruction inside a historic district is a measurable cost (LPC method, mock-up, in-kind or cast-stone rules). It is not captured by a borough PPSF.
- Garden, rear/south light, elevator, floor count. Rear-yard utility, exposure, and an elevator in a five-story shell are physical. They show up in the comparable set as lot coverage, orientation, and mechanical adequacy. No verified 2026 dollar premiums for garden, elevator, or “south light” are published in the reports cited, so none are stated.
- Landmark-district limits on exterior work. LPC review affects stoops, windows, cornices, rooftop additions, and brownstone resurfacing. Time, permit risk, and allowable materials are functional constraints. They can support a smaller pool of substitute properties; they do not automatically add value.
- Fee-simple townhouse versus brownstone subdivided into a co-op. A sandstone-fronted building sold as shares is a cooperative. It is appraised as a co-op: maintenance, underlying mortgage, flip tax, sublet policy, and recent line sales. It is not a 1–3 family indication, and a 1–3 family closing on the same block is not an unadjusted comp for a co-op line in that building.
- Thin sale sets; do not use condo/co-op comps unadjusted. Elliman’s entire Q2 recorded 1–3 family sample is 66 sales. BHS’s West Side first-half sample is 15; Midtown is 5. A Second Avenue condominium PPSF, or a West Village co-op median on a mixed-tenure portal, does not measure a brownstone. Expand geography only with a location adjustment the market recognizes — which, on the 2026 tape, is large.
What Could Not Be Verified
A Brown Harris Stevens second-half or Q2-only 2026 townhouse extract beyond the first-half report was not located. StreetEasy neighborhood pages with a townhouse-only closed median for West Village, Harlem, or the Upper West Side were not independently loaded as 1–3 family filters (mixed-tenure medians are omitted). Redfin neighborhood pages returned robot-check walls and are omitted rather than guessed. No Harlem-only, Chelsea-only, or Gramercy-only 2026 closed townhouse median from Elliman, Miller, or BHS is used. No verified dollar premium for width, garden, elevator, park-adjacent siting, or original interior detail is stated. Miller’s Q2 townhouse average (as opposed to median) price was not published in the Housing Notes write-up. Elliman Pulse Q2 did not publish days-on-market or sale-to-list for the 1–3 family segment in the pages extracted. Leslie Garfield’s Townhouse Index ($3.7 billion volume, 551 closings, trailing 12 months through August 2026) combines Manhattan and Brooklyn and is not used as a Manhattan-only print. Realtor.com West Village, Harlem, and Upper West Side key indicators are mixed tenure and are not used as brownstone values.
What This Means for Appraisal Work
Borough townhouse medians are briefing statistics. They are not a value opinion for a specific brownstone.
- Stay inside the row geography and the legal use. West Village / Greenwich Village, Chelsea / Gramercy, the Upper West Side belts, Upper East Side limestone-versus-brownstone streets, and Harlem / Hamilton Heights / Sugar Hill are separate competitive sets. BHS first-half medians already run from $2.1 million in Upper Manhattan to $9.225 million on the East Side and $8.0 million south of 14th Street.
- Name the filter when sources disagree. $5.23 million (Elliman Q2 recorded median), $5.56 million (BHS first-half median), $6.1 million (Miller Q2 median), $6.5 million (Corcoran Q1 median), and $10.5 million (Garfield first-half average) are different samples. Size mix (Miller’s 5,019-square-foot average) and trophy-width trades (Bank Street at $70 million) explain more of the gap than a hidden second market.
- Sandstone condition is a cost item. Face-bedded brownstone, failed stoops, and LPC in-kind rules belong in the cost and quality analysis. They are not absorbed by a neighborhood PPSF.
- Width, C of O, and tenure before time. A 16-foot two-family with a rent-regulated garden unit is not timed off a 25-foot single-family closing. A brownstone co-op is not timed off a fee-simple 1–3 family median.
- Condo and co-op comps stay in their own files unless a paired-sale or residual analysis supports a property-type adjustment. Unadjusted stacked-product PPSF will bias a brownstone opinion.
A Manhattan townhouse median is not a value opinion for a brownstone. Comps have to stay inside the competitive set — same neighborhood band, same width, same legal use, same sandstone or limestone facing. A West Village double-wide closing and a Harlem three-family row house can print in the same quarter and still have nothing to say to each other without those adjustments.
Reading 2026 Manhattan Brownstone Stats in an Appraisal
- Identify the filter: 1–3 family versus mixed tenure; recorded versus contract; median versus average; quarter versus first half
- Do not import Miller’s $6.1 million Q2 median or Garfield’s $10.5 million average as a Harlem, Chelsea, or 16-foot time adjustment
- Bracket BHS first-half geographic medians ($2.1 million Upper Manhattan through $9.225 million East Side) as 1–3 family prints, not as brownstone-only facades
- Use TRD’s West Village $3,524 PPSF and UWS $1,489 PPSF only inside those townhouse extracts
- Treat sandstone facing, stoop, width, C of O, and landmark-district rules as physical and legal characteristics
- Leave Chelsea-only and Harlem-only closed medians blank until a named 1–3 family extract publishes them; do not borrow realtor.com mixed-tenure medians
Final Thoughts
For attorneys, fiduciaries, and owners, the practical point is narrower than a borough headline. As of the 2026 tape cited above, Manhattan 1–3 family medians sit in a $5.2–$6.5 million band depending on shop and period, while averages are pulled higher by large, wide houses. Volume is thin — 66 Elliman recorded sales in Q2, 123 BHS sales in the first half — and it is not evenly spread. Downtown west of the Village, the Upper East Side, and Upper Manhattan do most of the closings; the Upper West Side’s remaining late-brownstone belts show up more clearly in PPSF change than in count. Those splits are housing stock, legal use, width, and sandstone condition. They are not a ranking of Manhattan.
Whether the purpose is estate settlement, tax grievance support, divorce, financing, or a gift-tax valuation, a defensible brownstone appraisal is built from matched 1–3 family sales in the subject’s row geography, width band, and legal occupancy. It is not imported from a condo median, and it is not borrowed from a Village double-wide without support.
Need an Appraisal of a Manhattan Brownstone?
Whether for estate planning, tax grievance, gift tax, or a mortgage transaction, we provide thorough, professional valuation of Manhattan 1–3 family dwellings, townhouses, and related residential property across Manhattan, Westchester, and the tri-state area.
Get a Free Quote