
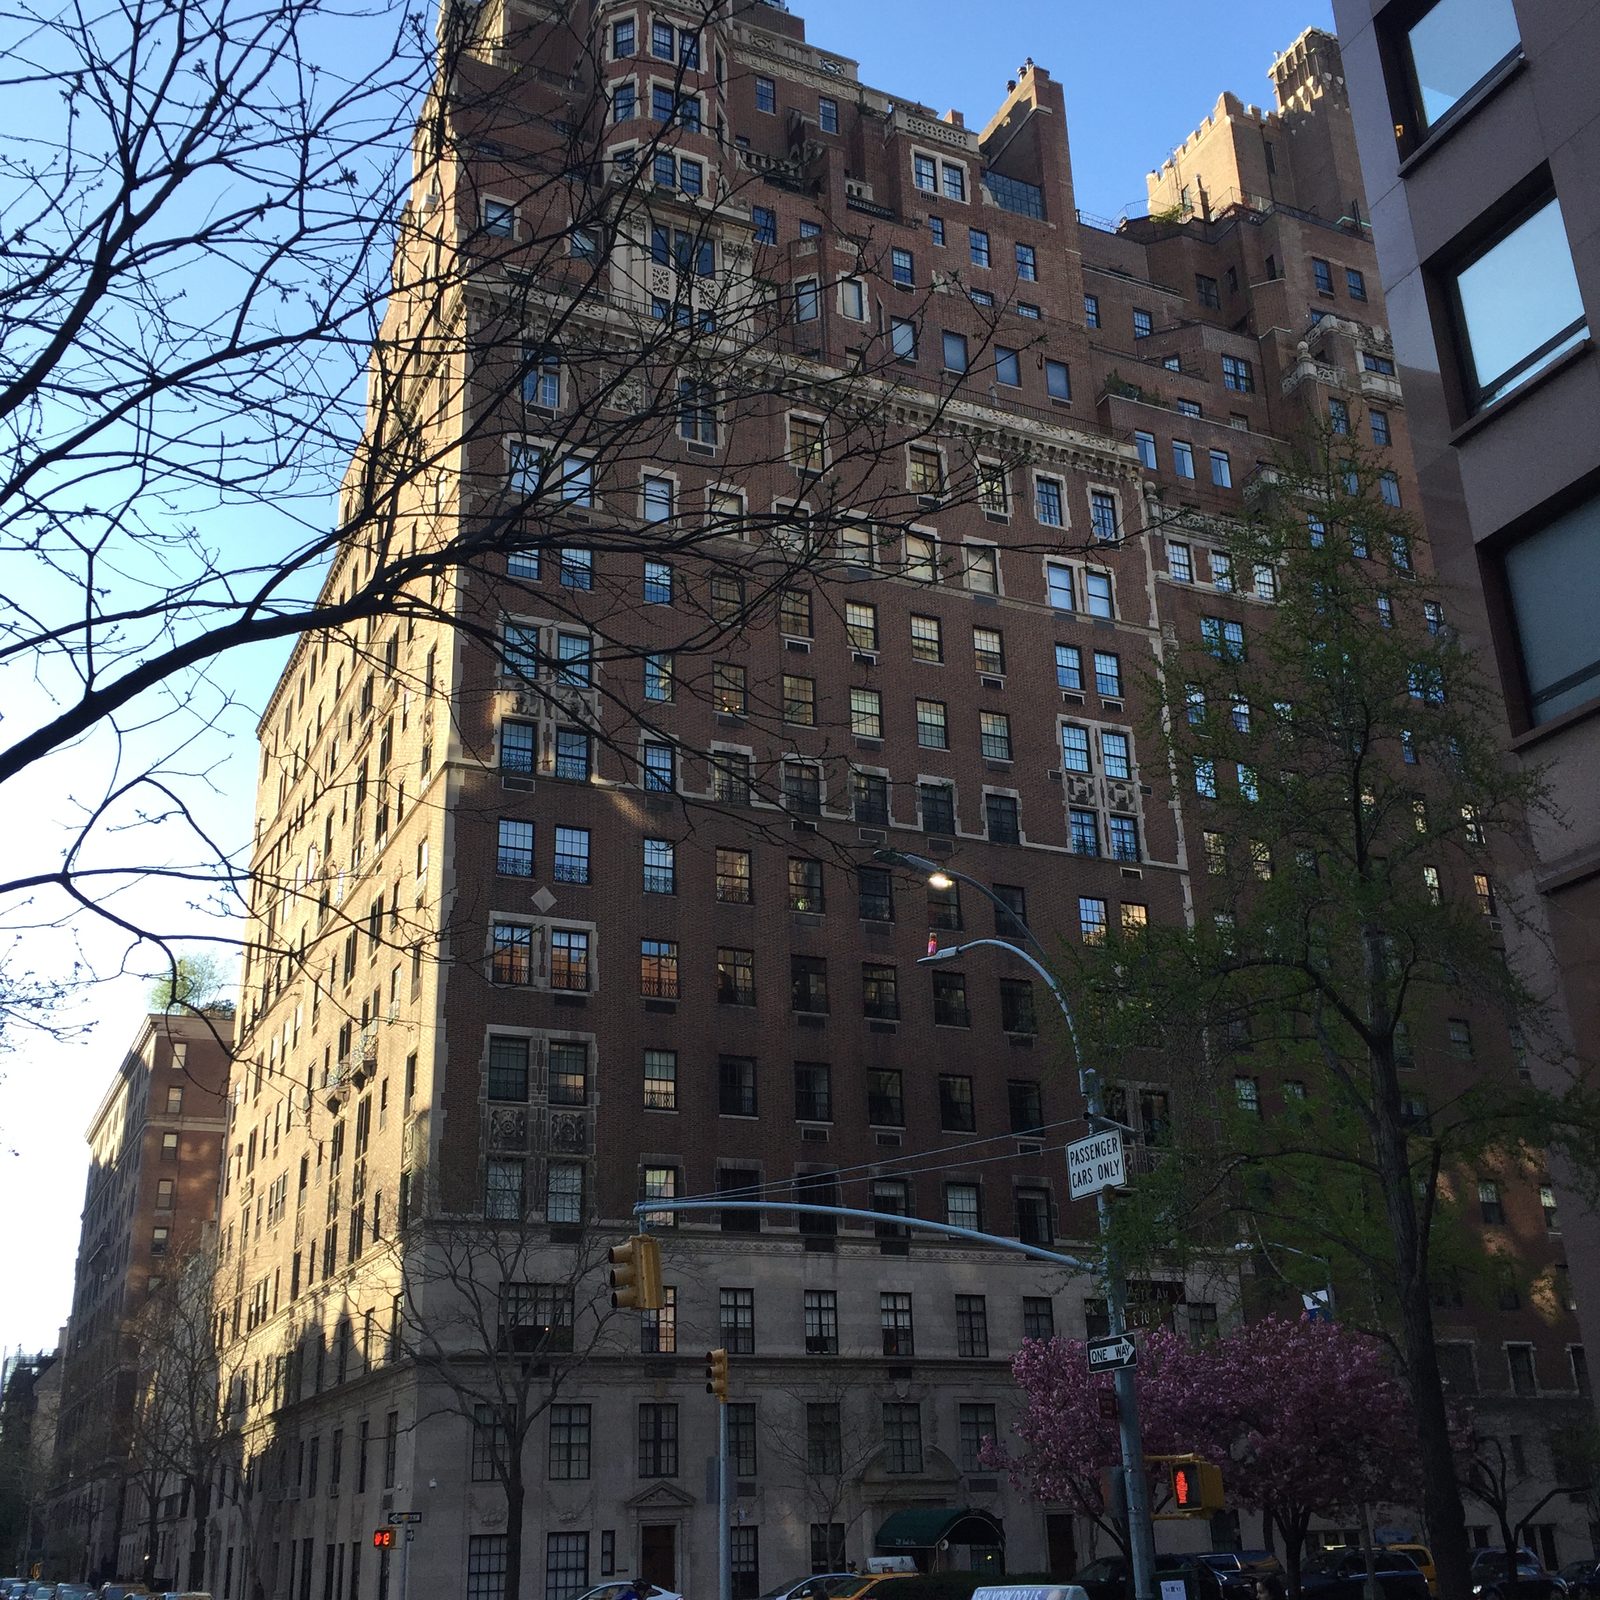
The Upper East Side is not one housing market. A single neighborhood median compresses co-ops, condominiums, and 1–3 family townhouses that do not compete with one another, and it also compresses location splits that show up on the listing tape: Park Avenue and Fifth Avenue limestone stock versus product east of Third Avenue; Carnegie Hill versus Yorkville. Those are housing-stock and geography splits, not lifestyle rankings. A Fifth Avenue co-op, a Second Avenue condo, and a townhouse off Lexington can close in the same month and still require different comparable sets.
In this briefing, “strong” and “soft” mean market performance only — recent median or average sale price, listing inventory, days on market, sale-to-list (or listing discount), and closed-sales or signed-contract volume. Those labels are not a ranking of neighborhood quality. Borough context is in the August 26 snapshot of the Manhattan housing market. Coverage of local residential work is described on the firm’s Manhattan appraisal page. This is a current market snapshot; it does not replace the firm’s earlier Upper East Side appraisal notes.
Neighborhood Snapshot: Prices, Inventory, and Days on Market
Published 2026 figures do not describe one Upper East Side price. They describe different filters — listing versus recorded sale, co-op versus condo versus townhouse, one month versus a trailing quarter, and different maps of “East Side.” The figures below were checked on the source pages in late August 2026. Where two sources disagree, the disagreement is usually mix and methodology, not a hidden “true” number.
- Manhattan Q2 2026, Corcoran (borough context): Signed contracts 3,477, up 5% year over year. Active inventory 7,182 listings, down 2% year over year. Median sale price $1.3 million, up 7%. Average days on market 115. Source: Corcoran Manhattan Real Estate Market Report, 2Q 2026.
- Manhattan Q2 2026, Brown Harris Stevens: Average apartment price $2,231,819, up 5%; median $1,290,000, up 6%. Resale apartments averaged 112 days on market and sold at 97.4% of last asking price. Resale co-op average $1,550,241, up 9%; resale condo average $2,384,749, down 5%. Source: Brown Harris Stevens Manhattan Apartment Market Report, Q2 2026.
- Manhattan Q2 2026, Miller / Housing Notes: Co-op and condo median $1,250,000, up 4.2%. Listing inventory 7,049, down 15%. Sales 2,849, down 6.3%. Source: Housing Notes, 2Q26 Manhattan Sales Inventory Remains Lean (July 2, 2026).
- Manhattan July 2026, Corcoran (contracts): 953 contracts signed, up 5% year over year. Average days on market 104, down 15%. Active listings 5,909, down 8%. Average discount off last ask 2.8% (condos 3.1%, co-ops 2.2%). All tracked submarkets were level or up year over year except the Upper West Side and Financial District/Battery Park City. Source: Corcoran Manhattan Condo & Co-Op Sales, July 2026.
- Manhattan July 2026, UrbanDigs via Howard Hanna NYC: 882 signed contracts, even with July 2025. Active listings 5,613, down 12.1%. Median sale price $1.33 million, up 7.6%. Days on market 65. Listing discount 3.8%. StreetEasy’s June recorded closings, cited in the same report, put the borough median at $1.23 million. A neighborhood-level Upper East Side StreetEasy median for June or July 2026 was not published on the pages checked. Source: Howard Hanna NYC Manhattan Market Update, August 2026.
- Upper East Side, realtor.com (key indicators as of June 2026): Median listing price $1,720,000, down 1.15% year over year. Median sold price $1,050,000, down 28.81% year over year. Listing price per square foot $1,441, down 1.11%. Active listings 1,942, down 8.42%. Median days on market 53, down 7.58%. Homes sold 2.4% below asking on average, with a sale-to-list ratio of 98%. Source: realtor.com Upper East Side housing market (Realtor.com Economic Research). The listing median and the sold median are not interchangeable: they are different samples, and a 28.81% year-over-year drop in the sold median against a nearly flat listing median is a mix warning, not a unit-level time adjustment.
Redfin’s Upper East Side housing-market page could not be loaded independently in late August 2026 (the public page returned a robot-check). Douglas Elliman’s Q2 2026 Manhattan PDF was cited in the borough briefing for townhouse mix; an Upper East Side-only Elliman median, inventory, and days-on-market table was not extracted as a stand-alone neighborhood print. StreetEasy’s June borough median is on the tape; a current UES-only StreetEasy median is not.
Co-op vs. Condo vs. Townhouse
Tenure is the first split. Co-op, condominium, and 1–3 family townhouse trade on different rules, different carrying costs, and different buyer pools. A borough or neighborhood median that blends them will mis-state all three.
Co-ops: the volume of the listing mix
On the BHS Q2 resale series, co-ops led the price gain: average resale co-op $1,550,241, up 9% year over year, with three-bedroom and larger units doing most of the work. Corcoran’s July contract tape was flatter: co-op contracts down 1% borough-wide, with co-op average price per square foot $1,158. That July co-op PPSF print fell 15% year over year, which Corcoran flagged as skewed by two resales above $4,000 per square foot in July 2025; excluding those, the co-op average was essentially unchanged. Those two facts can both be true. They are different filters (recorded resale averages versus July contracts).
For appraisal work, the co-op file is a building file: underlying mortgage, flip tax, sublet policy, financial statements, and recent line sales in the same cooperative. A Lenox Hill pre-war co-op is not a substitute for a Yorkville postwar co-op of similar room count, and neither is a substitute for a condominium in the same block.
Condos: PPSF up on the East Side resale table, averages down borough-wide
BHS’s East Side resale table (generally 59th to 96th Street, Fifth Avenue to the East River) put condominium average price per square foot at $1,578 in Q2 2026, up 6% from $1,483 a year earlier. That is a tighter product filter than a blended UES median. Borough-wide, the same report had resale condo averages down 5% to $2,384,749, “due in part to a decline in closings of over $20 million.” Corcoran July contracts had condos up 12% in count, with condo average PPSF $1,830, down 2%. A rising East Side condo PPSF and a softer borough resale-condo average are not a contradiction. They are different competitive sets.
Townhouses: thin volume, tight inventory, mix-driven medians
Miller’s Q2 Manhattan 1–3 family read is still the cleanest townhouse print: median $6,100,000, up 28.4% year over year; listing inventory 291, down 39.9%. Average sale size jumped 14.7% to 5,019 square feet, so part of the median move is mix. Elliman’s Q2 recorded 1–3 family sales totaled 66; of that thin sample, the Upper East Side accounted for 25.4% of recorded townhouse closings (Downtown West 30.2%, Upper Manhattan 28.6%, Upper West Side 9.5%, Downtown East 6.3%). A 66-sale borough sample is not a block-level absorption rate. A townhouse appraisal cannot import a stacked-condo absorption rate from Second Avenue, and it cannot treat a mix-driven borough townhouse median as a time adjustment for a 16-foot brownstone.
Location Splits: Park/Fifth, East of Third, Carnegie Hill, Yorkville
The Upper East Side’s listing tape is not one bid. Realtor.com’s June 2026 neighborhood table is listing-price and listing-count data, not closed medians, and the sub-area maps are the vendor’s. Read them as inventory and asking-price splits:
- Yorkville: median listing $1,075,000 ($1,276/sq ft); 511 homes for sale, down 15.20% year over year; median days on market 53, down 13.11% year over year.
- Carnegie Hill: median listing $2,300,000 ($1,551/sq ft); 224 homes for sale, down 11.74%; median days on market 58, down 14.71%.
- Lenox Hill: median listing $3,295,000 ($1,909/sq ft); 465 homes for sale, down 11.91%; median days on market 70, down 4.11%.
- Metropolitan Hill: median listing $3,222,500 ($1,871/sq ft); median days on market 69.
Source: realtor.com Upper East Side, key indicators as of June 2026. Yorkville’s listing median sits about $1.2 million below Carnegie Hill and about $2.2 million below Lenox Hill on that table. That is an asking-price and housing-stock split — more postwar and smaller-line inventory east of Third versus larger pre-war and Park/Fifth product to the west and north — not a statement about who lives where.
ZIP-level listing medians on the same realtor.com page (charts through May 2026) line up with the same geography: 10021 $1,425,000; 10028 $2,150,000; 10065 $2,036,500; 10075 $1,325,000; 10128 $1,437,500. Median days on market by ZIP: 10128 40 days; 10075 51; 10028 54; 10021 59; 10065 61. A 10065 (Lenox Hill / mid-60s) listing median is not a 10075 (upper Yorkville) indication.
BHS’s East Side resale bedroom table (Q2 2026 versus Q2 2025) is the closed-sale companion, on a 59th-to-96th, Fifth-to-East-River map: studio median $477,000 (+9%); one-bedroom $712,500 (−5%); two-bedroom $1,542,500 (+1%); three-bedroom and larger $3,310,000 (about unchanged). Studio and two-bedroom medians firmer, one-bedrooms softer, large units flat — that is a mix and size story inside one East Side resale sample. It is not a Park Avenue time adjustment.
SERHANT’s Q2 commentary, reported by Brick Underground on July 2, 2026, called the Upper East Side the quarter’s standout submarket with a 36.4% increase in deals year over year, and four-bedroom-and-larger units up 41.3% in sales volume. That is a SERHANT research print, not Elliman, Corcoran, or BHS. Volume up in one shop’s Q2 table can sit next to mixed bedroom medians on BHS and a nearly flat realtor.com listing median. Use the filter that matches the subject.
What This Means for Appraisal Work
The neighborhood numbers are context. They are not a time adjustment, a listing-to-sale discount, or a value opinion for a specific unit.
- Building-level comps first. Same cooperative or same condominium, then adjacent buildings of the same tenure and era. A Park Avenue co-op closing is not an indication for a Second Avenue condo, even when both are “Upper East Side.”
- Co-op financials are marketability items. Underlying mortgage, reserve position, flip tax, and ongoing assessments affect what a buyer will pay. They do not collapse into realtor.com’s $1,441 listing PPSF or BHS’s $1,578 East Side condo PPSF.
- Townhouse versus stacked product. Miller’s townhouse inventory (291 listings, −39.9%) and a Second Avenue condo with several similar lines on the market are different competitive sets. Do not import a stacked-product absorption rate into a 1–3 family report, or a townhouse median into a co-op.
- Location support has to match the subject’s band. Carnegie Hill’s $2.3 million listing median and Yorkville’s $1.075 million listing median are not substitutes. East of Third versus Park/Fifth is a location and housing-stock adjustment, not a “neighborhood quality” adjustment.
- When sources disagree, keep both prints. Realtor.com’s June sold median ($1,050,000, −28.81%) versus listing median ($1,720,000, −1.15%) is the clearest current example. BHS East Side condo PPSF up 6% versus borough resale condo averages down 5% is another. Do not pick a winner. Bracket the filter.
An Upper East Side median is not a value opinion. Comps have to stay inside the competitive set — same tenure, same product, same slice of the East Side. A Park Avenue co-op and a Yorkville condo can print in the same month and still have nothing to say to each other.
Reading 2026 Upper East Side Stats in an Appraisal
- Identify the filter: co-op, condo, or 1–3 family; contracts versus recorded closings; listing versus sold
- Do not import the borough median ($1.25–$1.33 million depending on shop and month) as an UES time adjustment
- Treat realtor.com’s $1.72 million listing median and $1.05 million sold median as a range across samples, not as a single market price
- Match Park/Fifth, east of Third, Carnegie Hill, and Yorkville on location and housing stock before adjusting for time
- Support sale-to-list and days on market from the subject’s building and tenure (BHS resales 97.4% of last ask; realtor.com UES 98%; Corcoran July 2.8% average discount)
- Pull co-op financials and recent line sales in the subject building before using a neighborhood PPSF
Final Thoughts
For attorneys, fiduciaries, and owners, the practical point is narrower than the headlines. As of late August 2026, the Upper East Side sits inside a tight Manhattan apartment market — borough medians clustered near $1.25–$1.33 million, July inventory near 5,600–5,900 listings — but the neighborhood is not one bid. Co-op resale averages were firmer than resale condo averages on the BHS Q2 series. East Side condo PPSF was up 6% on that same resale table. Realtor.com’s June listing tape still shows Yorkville asking prices well below Carnegie Hill and Lenox Hill. Townhouse volume is thin. SERHANT reported a large year-over-year jump in UES deal count in Q2; BHS bedroom medians on the East Side were mixed. Those prints can coexist because they measure different things.
Whether the purpose is estate settlement, tax grievance support, divorce, financing, or a gift-tax valuation, a defensible Upper East Side appraisal is built from the subject building, the subject tenure, and matched sales in the same location band. It is not imported from a neighborhood nickname or a borough median. Related reading: the Manhattan market update and the firm’s earlier Upper East Side appraisal notes.
Need an Appraisal in Manhattan?
Whether for estate planning, tax grievance, gift tax, or a mortgage transaction, we provide thorough, professional valuation services across Manhattan, Westchester, and the tri-state area.
Get a Free Quote