
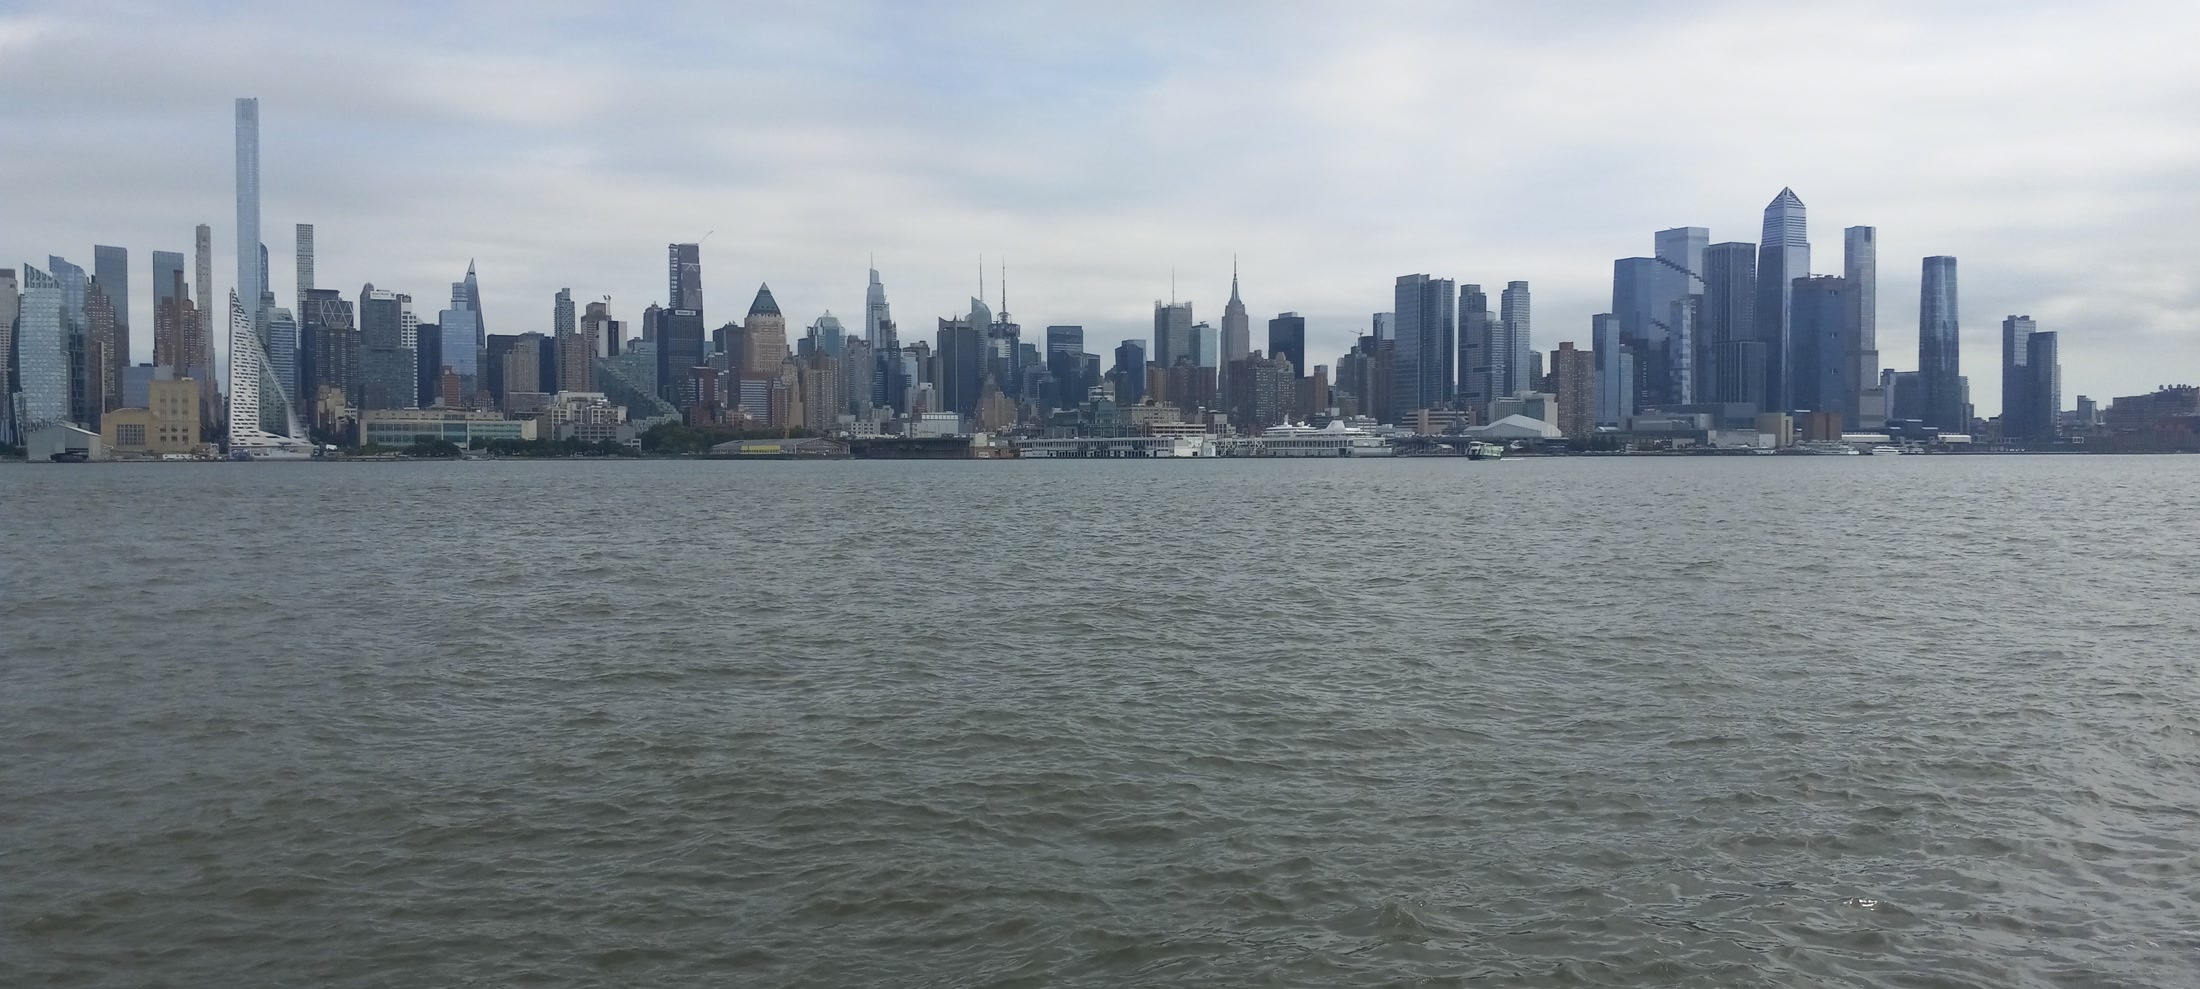
Manhattan is not one housing market. A borough-wide median, a single days-on-market print, or a citywide inventory count compresses submarkets that do not compete with one another. A West Village townhouse, an Upper East Side pre-war co-op, a Financial District condo, and a new-development stack in Hudson Yards can close in the same month and still require different comparable sets. Property type matters as much as geography: co-op, condominium, and 1–3 family townhouse trade on different rules, different carrying costs, and different buyer pools.
In this briefing, “strong” and “soft” mean market performance only — recent median or average sale-price change, listing inventory, days on market, sale-to-list (or listing discount), and closed-sales or signed-contract volume. Those labels are not a ranking of neighborhood quality, and they are not a statement about who lives where. Coverage of local residential work is described on the firm’s Manhattan appraisal page. A county-level companion is the August 25 snapshot of Westchester versus the U.S. market.
Borough Snapshot: Prices, Inventory, and the Rate Backdrop
Published 2026 figures do not describe one Manhattan price. They describe different filters — contracts versus recorded closings, resale versus new development, co-op versus condo versus townhouse, one month versus a trailing quarter. The figures below were checked on the source pages in late August 2026. Where two sources disagree, the disagreement is usually mix and methodology, not a hidden “true” number.
- U.S. existing homes, July 2026 (NAR): Median existing-home price $434,100, up 2.0% from $425,700 a year earlier. Northeast median $563,800, up 5.2%. Unsold inventory equaled a 4.6-month supply. Source: NAR Existing-Home Sales, July 2026 (released August 11, 2026).
- Westchester single-family, July 2026 (OneKey / HGAR): Median sales price $1,258,000, up 9.4% from July 2025. That is a detached-home filter in a suburban county, not an apartment median, which is why it sits next to Manhattan’s prints rather than against them. Source: July 2026 Westchester County Market Report (OneKey / HGAR).
- Manhattan Q2 2026, Corcoran: Signed contracts 3,477, up 5% year over year — a five-year high. Closed sales declined 7%. Active inventory 7,182 listings, down 2% year over year, the lowest second-quarter inventory in eight years. Median sale price $1.3 million, up 7% year over year. Average days on market 115, the eighth consecutive quarter of year-over-year improvement. Sales under $2 million declined 11% year over year; sales above $2 million increased 4%. New-development launches fell 37% year over year to 160 units. Source: Corcoran Manhattan Real Estate Market Report, 2Q 2026.
- Manhattan Q2 2026, Douglas Elliman: Signed contracts 3,188, up 4.0% year over year. Recorded sales 3,161, up 4.0% in count; dollar volume $8.17 billion, up 19.4%. Recorded median price $1.31 million, up 5.2% year over year. New listings 4,851, down 6.7% year over year. Condo signed contracts rose 5.5% while Elliman reported condo median prices down 2.8% and average price per square foot down 3.3%. Co-op signed contracts declined about 1–2% with contract medians down 2.6%. New-development signed contracts 310, down 14.6%; recorded new-development sales 466. 1–3 family signed contracts 52, down 26.8%; recorded 1–3 family sales 66 at a $5.23 million median. Source: Douglas Elliman Pulse Q2 2026 Sales Report, Manhattan.
- Manhattan Q2 2026, Brown Harris Stevens: Average apartment price $2,231,819, up 5% year over year; median $1,290,000, up 6% — both the second-highest figures on record (records set in Q2 2019). Number of sales was virtually unchanged from Q2 2025. Resale apartment average $1,881,899; resale co-op average $1,550,241, up 9%; resale condo average $2,384,749, down 5%. Resale apartments averaged 112 days on market (3% faster than a year earlier) and sold at 97.4% of last asking price, up from 96.9%. Source: Brown Harris Stevens Manhattan Apartment Market Report, Q2 2026.
- Manhattan Q2 2026, Miller / Housing Notes (with The Real Deal): Co-op and condo median $1,250,000, up 4.2% year over year, described as a record, buoyed by new-development closings. Average $2,113,806 (+0.7%); average price per square foot $1,694 (+2.7%). Listing inventory 7,049, down 15% year over year. Sales 2,849, down 6.3%. New-development active inventory 445, down 62.2%; existing inventory 6,604, down 7.2%. Share of sales above $1 million: 57.9%, the highest on record. Bidding-war share 11.9%, up from 7.1%. Source: Housing Notes, 2Q26 Manhattan Sales Inventory Remains Lean (July 2, 2026).
- Manhattan July 2026, Corcoran (contracts): 953 contracts signed, up 5% year over year — the best July in five years. Co-op contracts down 1%; condo contracts up 12%. Average days on market 104, down 15% year over year. Active listings 5,909, down 8% year over year, the lowest July level since 2017. Average price per square foot $1,674, down 3% year over year. Average discount off last ask 2.8%. Source: Corcoran Manhattan Condo & Co-Op Sales, July 2026.
- Manhattan July 2026, UrbanDigs via Howard Hanna NYC: 882 signed contracts, even with July 2025. Active listings 5,613, down 12.1% year over year. Median sale price $1.33 million, up 7.6% year over year — the strongest print of 2026 on that series. Median price per square foot $1,483, up 4.2% year over year. Days on market 65. Listing discount 3.8%. Pending sales 3,938, up 27.8% year over year. Source: Howard Hanna NYC Manhattan Market Update, August 2026 (UrbanDigs July 2026 actuals). StreetEasy’s June closings, cited in the same report, put the borough median at $1.23 million.
- Mortgage-rate backdrop (Freddie Mac PMMS): The 30-year fixed-rate mortgage averaged 6.65% as of August 20, 2026, down from 6.67% the prior week and compared with 6.58% a year earlier. The 15-year averaged 5.95%. That is the financing backdrop for rate-sensitive demand, especially below the cash-heavy luxury tiers. Source: Freddie Mac Primary Mortgage Market Survey, week of August 20, 2026.
Read together: Manhattan apartment medians in Q2 clustered near $1.25–$1.31 million depending on the shop, against a U.S. existing-home median of $434,100 in July and a Westchester single-family median of $1.26 million in the same month. Inventory is tight on every major Manhattan series, but the counts are not interchangeable — Corcoran’s 7,182 (Q2) and Miller’s 7,049 (Q2) sit next to July prints of 5,909 (Corcoran) and 5,613 (UrbanDigs). Days on market of 115 (Corcoran Q2 average), 112 (BHS resale average), 104 (Corcoran July average), and 65 (UrbanDigs July) are different definitions. A borough median is a briefing statistic. It is not a value opinion for a specific co-op, condo, or townhouse.
Stronger-Performing Corners (Price, Inventory, Absorption)
The neighborhoods and product types below printed tighter inventory, rising medians or price per square foot, and/or higher contract or closing volume on 2026 reports. That is market performance. A high closing price is not, by itself, a “strong” market — Soho and Tribeca close at high medians in almost any cycle. What follows is only what a 2026 report actually measured.
Townhouses: prices up, listings down, volume thin
Miller’s Q2 townhouse (1–3 family) read is the clearest “tight inventory / rising median” print in the borough. Median price rose 28.4% year over year to $6,100,000; listing inventory fell 39.9% to 291, which is 21.4% below the decade average of 370. Average sale size jumped 14.7% to 5,019 square feet, so part of the median move is mix: larger houses traded. Average price per square foot was up 18.1% in the headline and about 4% after that size shift, per Miller. The Real Deal’s Q2 analysis (July 14, 2026) put the 1–3 family median at $6 million, up more than 38%, on 55 deals, down 11.3% year over year. Elliman’s Q2 1–3 family signed contracts fell 26.8% to 52. On the numbers: inventory and price look tight; unit volume does not. A townhouse appraisal cannot import a condo-tower absorption rate, and it cannot treat a mix-driven median as a time adjustment.
Co-op medians outpaced condo medians in some Q2 series
TRD Data’s recorded-sale analysis put the Q2 Manhattan co-op median at $895,000, up 8.5% year over year, against a condo median up 2.9% (new-development condos up 7.6%). Transaction counts still fell for both: condos −3.8%, co-ops −1.9%. BHS’s resale series agrees on direction for co-ops: average resale co-op price $1,550,241, up 9%, while resale condo averages were down 5%. Elliman does not agree on the contract tape — it reported co-op contract medians down 2.6% and condo median prices down 2.8%. Those are different samples (contracts vs. recorded closings; resale vs. all condos). The appraisal takeaway is not “co-ops are winning.” It is that co-op and condo are not substitutes, and a borough median that blends them will mis-state both.
Upper Manhattan: July contract volume, mixed bedroom medians
Corcoran’s July contract report is the cleanest neighborhood-volume print available for late summer. All tracked submarkets were level or up year over year except the Upper West Side and Financial District/Battery Park City. Upper Manhattan posted the largest increase, up 23% (19 additional deals). That is signed-contract count, not a quality ranking and not a migration story. BHS’s Q2 resale medians for Upper Manhattan (generally north of 96th Street on the East Side and 110th Street on the West Side) were mixed by bedroom count: one-bedrooms $465,000 (+16%), two-bedrooms $757,500 (+22%), three-bedrooms and larger $750,000 (−24%). Studio medians were unchanged at $280,000. Condo price per square foot in that BHS area was slightly lower than a year earlier. Volume up in July, some bedroom medians up in Q2, larger units down — treat Upper Manhattan as a split, not a single bid.
$3–$5 million resale condos south of 34th Street
Corcoran’s July contracts showed the largest year-over-year increase in the $3 million to $5 million band, “driven by strong resale condo activity south of 34th Street.” Miller’s Q2 sales-by-price-tranche table is consistent with demand concentrating above the entry level: the only two tranches with annual sales growth were $2–$3 million (+1.1%) and $3–$4 million (+12%). Corcoran’s Q2 report made the same split at a coarser cut: sales under $2 million −11%, sales above $2 million +4%. That is price-band performance, not a claim about who is buying.
East Side and West Side resale condo price per square foot (Q2)
BHS’s Q2 resale tables, which hold property type closer to constant than a blended neighborhood median, showed East Side (59th to 96th Street) condo average price per square foot at $1,578, up 6% from $1,483 a year earlier. West Side (59th to 110th Street) condo PPSF was $1,756, up 11% from $1,579. Bedroom medians on the West Side were not uniformly up: one-bedrooms $793,500 (−7%), two-bedrooms $1,614,500 (+3%), three-bedrooms and larger $2,812,500 (−10%). PPSF strength with mixed bedroom medians is usually a mix and size story. It still beats Midtown’s Q2 resale condo PPSF, which BHS put at $1,325, down 9% from $1,458.
Luxury listing scarcity is a supply print, not a neighborhood
Miller’s luxury slice — the top 10% of the market, which began at $4,450,000 in Q2 — had 796 listings at quarter-end, the lowest in 22 years of that series. Median luxury price was $6,451,500, down 1.1%, with average size also down 1.7%. Scarce listings can support prices without producing a higher median if the mix shifts smaller. Corcoran Sunshine data reported by Commercial Observer on August 13, 2026 counted 302 sales above $5 million from April 18 to August 7, versus 268 in the stretch just before New York City’s pied-à-terre surcharge was enacted. The $5–$15 million band was up 2% year over year and the $15–$25 million band up 8%; sales at $25 million and above were down 20%. Tight luxury inventory and a split inside $5 million-plus are both on the tape. They are not the same fact.
StreetEasy’s June recorded closings, as cited by Howard Hanna NYC, are useful as levels, not as performance ranks: among submarkets with at least eight sales, Soho led at $3.35 million, then Tribeca at $3.00 million, then Greenwich Village at $1.98 million, against a borough median of $1.23 million. Monthly neighborhood samples are small. A high median in Soho or Tribeca does not, without a year-over-year inventory or absorption companion, earn a “strong” label in this briefing. Related building-stock notes are in the firm’s West Village and Greenwich Village appraisal pieces.
Softer-Performing Corners (Inventory, DOM, Price, Volume)
The prints below show more (or relatively looser) inventory, longer marketing time, price cuts or declining medians, and/or fewer contracts or closings. Again: market performance, not neighborhood quality.
Financial District / Battery Park City: the steepest July contract drop
Corcoran’s July submarket table is explicit. Financial District/Battery Park City had the steepest decline in signed contracts, down 14% (seven fewer deals). The Upper West Side was the other submarket that was not level or up. Seven deals is a small absolute number; the direction still matters because it is the same report that had Upper Manhattan up 23%. FiDi’s spring monthly medians, republished via Homix from Redfin as of March–April 2026, looked volatile to the upside (~$1.2 million, +25%). A volatile monthly median and a July contract decline can both be true. Neither is a substitution for building-level comps in a downtown condo tower.
Midtown resales: lower bedroom medians and lower condo PPSF
BHS’s Q2 Midtown resale table (34th to 59th Street) is the softest large-area price print in that report. Two-bedroom median $1,265,000 (−11%), three-bedroom and larger $2,162,500 (−10%), one-bedroom $722,500 (−4%). Studios were the exception at $479,500 (+12%). Condo average price per square foot $1,325, down 9%. That is resale apartments in a defined geography, not a comment on new-development asking prices a few blocks west.
Downtown 14th-to-34th Street resales, and larger units south of 14th
BHS’s downtown resale area from 34th to 14th Street posted lower medians in every bedroom count: studio −5%, one-bedroom −6%, two-bedroom −1%, three-bedroom and larger −6%. South of 14th Street, studio medians were up 9% to $597,500, but one-bedrooms were −3%, two-bedrooms −5%, and three-bedrooms and larger −10% ($4,500,000 vs. $4,995,000). Condo PPSF south of 14th Street was slightly higher year over year ($1,862 vs. $1,846). High downtown price levels and softer year-over-year bedroom medians can coexist. That is why a Greenwich Village or Tribeca comparable set has to be matched on size, tenure, and building class, not on “downtown.”
Entry-level sales and larger co-ops
Corcoran’s Q2 under-$2 million sales (−11%) and Miller’s finding that only the $2–$4 million tranches grew are the borough-level version of the same split. On the July UrbanDigs tape, Howard Hanna NYC flagged larger co-ops as the softest bedroom slice: three-bedroom co-op median −6.7% year over year, four-bedroom and larger −17.7%. Condo two-bedrooms printed +27.0% on that monthly series, with an explicit small-sample warning. Elliman’s Q2 co-op recorded four-bedroom-and-larger median was $3.50 million with a large year-over-year swing in the table — another mix warning, not a unit-level time adjustment.
New development: fewer launches, fewer contracts, collapsing listings
This is the appraisal-relevant split, not a neighborhood nickname. Corcoran: new-development launches 160 in Q2, down 37% year over year, about half the historical second-quarter average. Elliman: new-development signed contracts 310, down 14.6%; recorded sales 466. Miller: new-development active listings 445, down 62.2%, versus existing inventory down 7.2%. BHS: new-development average closing price up 17% year over year, with most of that gain attributed to larger apartments; per-square-foot average was up 4%, and the West Side accounted for 21.9% of new-development closings. Asking prices in a new stack are not resale comps. A closing that was contracted 12–24 months earlier is not current demand. Thin new-development inventory can lift recorded medians while signed-contract volume falls. Those two facts have to stay separate in the report.
Ultra-luxury and the pied-à-terre overlay
New York City’s pied-à-terre surcharge on non-primary residences, enacted in spring 2026 and effective July 1, is a carrying-cost change at the top of the market. Corcoran’s Q2 commentary said overall contracts hit a four-year high while activity above $5 million had softened since the tax was announced, with the sharpest pullback at the ultra-luxury end. Corcoran Sunshine’s mid-August read, noted above, found $25 million-and-above sales down 20% year over year even as $5–$25 million held up. Olshan Realty’s weekly $4 million-and-above contract count for the third week of August was 15, against a 10-year average of 17 for that week — a seasonal luxury pulse, not a neighborhood ranking. Source: Olshan Luxury Market Report (week of August 17–23, 2026). The tax is a market overlay. It is not a statement about who belongs in a building.
Where Demand Is Showing Up
Two different questions get mixed together. One is metro-level search and relocation. The other is which Manhattan submarkets are taking more contracts or closings. Neighborhood-level “who is moving to which block” data is not solid enough in the 2026 public reports to use, so this section does not invent it.
Metro-level search (Redfin, Q1 2026). New York was the largest-outflow metro in Redfin’s first-quarter 2026 house-hunter analysis: net outflow of 28,351 Redfin.com searchers, with Miami as the top destination. Orlando, Miami, and Tampa all listed New York as a top origin. The New York outflow is still large, and it is smaller than the roughly 46,000 net outflow Redfin recorded for New York in 2022. Nationally, 19.1% of U.S. house hunters searched to relocate across metros, the highest share in a series that starts in 2021. Redfin’s New York City housing-market page for the same quarter reported that 23% of New York homebuyers searched to move out of the metro and 77% searched to stay; among outbound searches, Miami, Philadelphia, and Orlando led. That is search activity, not a count of actual moves, and it is metro-wide — it does not map onto a Manhattan neighborhood. Sources: Redfin, “19% of House Hunters Are Looking to Relocate,” June 29, 2026; Redfin New York City housing market.
Inside Manhattan, use sales and listings, not a migration story. The 2026 reports that break out geography show demand as contracts and closings, not as a flow of households:
- July signed contracts: Upper Manhattan +23%; Financial District/Battery Park City −14%; Upper West Side also down. Source: Corcoran, July 2026.
- July price band: largest gain $3–$5 million, concentrated in resale condos south of 34th Street. Source: Corcoran, July 2026.
- Q2 price band: sales growth only in $2–$4 million; record share of sales above $1 million (57.9%). Source: Miller / Housing Notes.
- Q2 product type: townhouse unit volume down, townhouse inventory down more; new-development contracts down; resale co-op averages up on the BHS series; resale condo averages down. Sources: Miller, Elliman, BHS, TRD.
- Elliman’s Q2 1–3 family recorded-sales share by market put Downtown West at 30.2% of those closings, Upper Manhattan 28.6%, Upper East Side 25.4%, Upper West Side 9.5%, Downtown East 6.3% — a distribution of a 66-sale sample, not a migration map.
If a later StreetEasy or Redfin neighborhood-search series publishes a stable 2026 inbound/outbound table for Manhattan submarkets, that would belong here. As of August 26, 2026, it is not on the pages checked. Substituting “people are moving to X” for “X took more contracts” would overstate the evidence.
What This Means for Appraisal Work
The borough numbers are context. They are not a time adjustment, a listing-to-sale discount, or a value opinion for a specific unit.
- Comps cannot cross from a tight townhouse pocket into a high-inventory condo tower. Miller’s townhouse inventory (291 listings, −39.9%) and new-development inventory (445 listings, −62.2%) are different competitive sets from a resale condo with months of similar line-ups in the same building. A FiDi tower closing is not a West Village townhouse indication, and a Hudson Yards asking price is not a resale co-op indication.
- Co-op versus condo is a tenure adjustment, not a neighborhood adjustment. TRD’s Q2 co-op median ($895,000, +8.5%) and BHS’s resale co-op average (+9%) sit beside Elliman’s softer condo median and BHS’s resale condo average (−5%). Board approval, underlying mortgage, flip tax, sublet rules, and monthly maintenance versus common charges plus taxes are the marketability items. They do not collapse into a borough PPSF.
- New-development asking prices are not resale comps. Contracts signed 12–24 months before closing, sponsor concessions, and a 62% year-over-year drop in new-development listings are why a recorded new-development median can rise while signed-contract volume falls. Use resales in the competitive set unless the assignment is the new stack itself, and then use the stack’s own contracts and concessions.
- Time adjustments when submarkets diverge. Corcoran’s Q2 borough median was up 7%; Midtown resale two-bedrooms were down 11% on the BHS table; Upper Manhattan two-bedrooms were up 22% on the same BHS table. A 7% borough time adjustment applied to both is a miss. Paired sales in the subject’s property type and submarket still govern.
- Sale-to-list is not a citywide concession rate. BHS resales at 97.4% of last ask, Corcoran July at a 2.8% average discount, UrbanDigs July at a 3.8% listing discount, and Corcoran Sunshine’s $25 million-plus softness are different slices. Applying a luxury weekly discount from Olshan to a $900,000 co-op, or a U.S. existing-home statistic to a Manhattan condo, will bias the opinion.
A Manhattan median is not a value opinion. Comps have to stay inside the competitive set — same tenure, same product, same submarket. A tight townhouse pocket and a high-inventory condo tower can print in the same month and still have nothing to say to each other.
Reading 2026 Manhattan Stats in an Appraisal
- Identify the filter: co-op, condo, 1–3 family, new development, or mixed; contracts versus recorded closings
- Do not import NAR’s 2.0% U.S. price change or 4.6-month supply as a Manhattan time adjustment
- Treat Q2 medians of $1.25–$1.31 million as a range across shops, not as a disagreement to “pick a winner”
- Bracket July inventory (about 5,600–5,900) separately from Q2 inventory (about 7,000–7,200)
- Support sale-to-list and days on market from the subject’s property type and submarket
- Keep the pied-à-terre surcharge in the luxury carrying-cost discussion where the interest is a non-primary residence — not as a neighborhood label
Final Thoughts
For attorneys, fiduciaries, and owners, the practical point is narrower than the headlines. As of late August 2026, Manhattan apartment medians sit far above the U.S. existing-home median and in a different product universe from Westchester’s single-family median. Inventory is tight on every major series. That tightness is not evenly distributed. Townhouse listings are scarce and townhouse medians are up, on thin volume. Co-op and condo are not moving together. Upper Manhattan took more July contracts; Financial District/Battery Park City took fewer. Midtown resale bedroom medians and condo PPSF were softer in Q2. New-development launches and signed contracts are down even as recorded new-development prices can look firm because of mix and a collapsing listing pipeline. Metro-level Redfin search still shows New York as the largest outbound metro, with Florida metros among the top destinations; that search data does not identify which Manhattan blocks are gaining or losing households. Inside the borough, demand shows up as sales, inventory, and price.
Whether the purpose is estate settlement, tax grievance support, divorce, financing, or a gift-tax valuation, a defensible Manhattan appraisal is built from physical evidence and matched market data in the subject’s competitive set. It is not imported from a borough median, a U.S. existing-home print, or a neighborhood nickname.
Need an Appraisal in Manhattan?
Whether for estate planning, tax grievance, gift tax, or a mortgage transaction, we provide thorough, professional valuation services across Manhattan, Westchester, and the tri-state area.
Get a Free Quote