
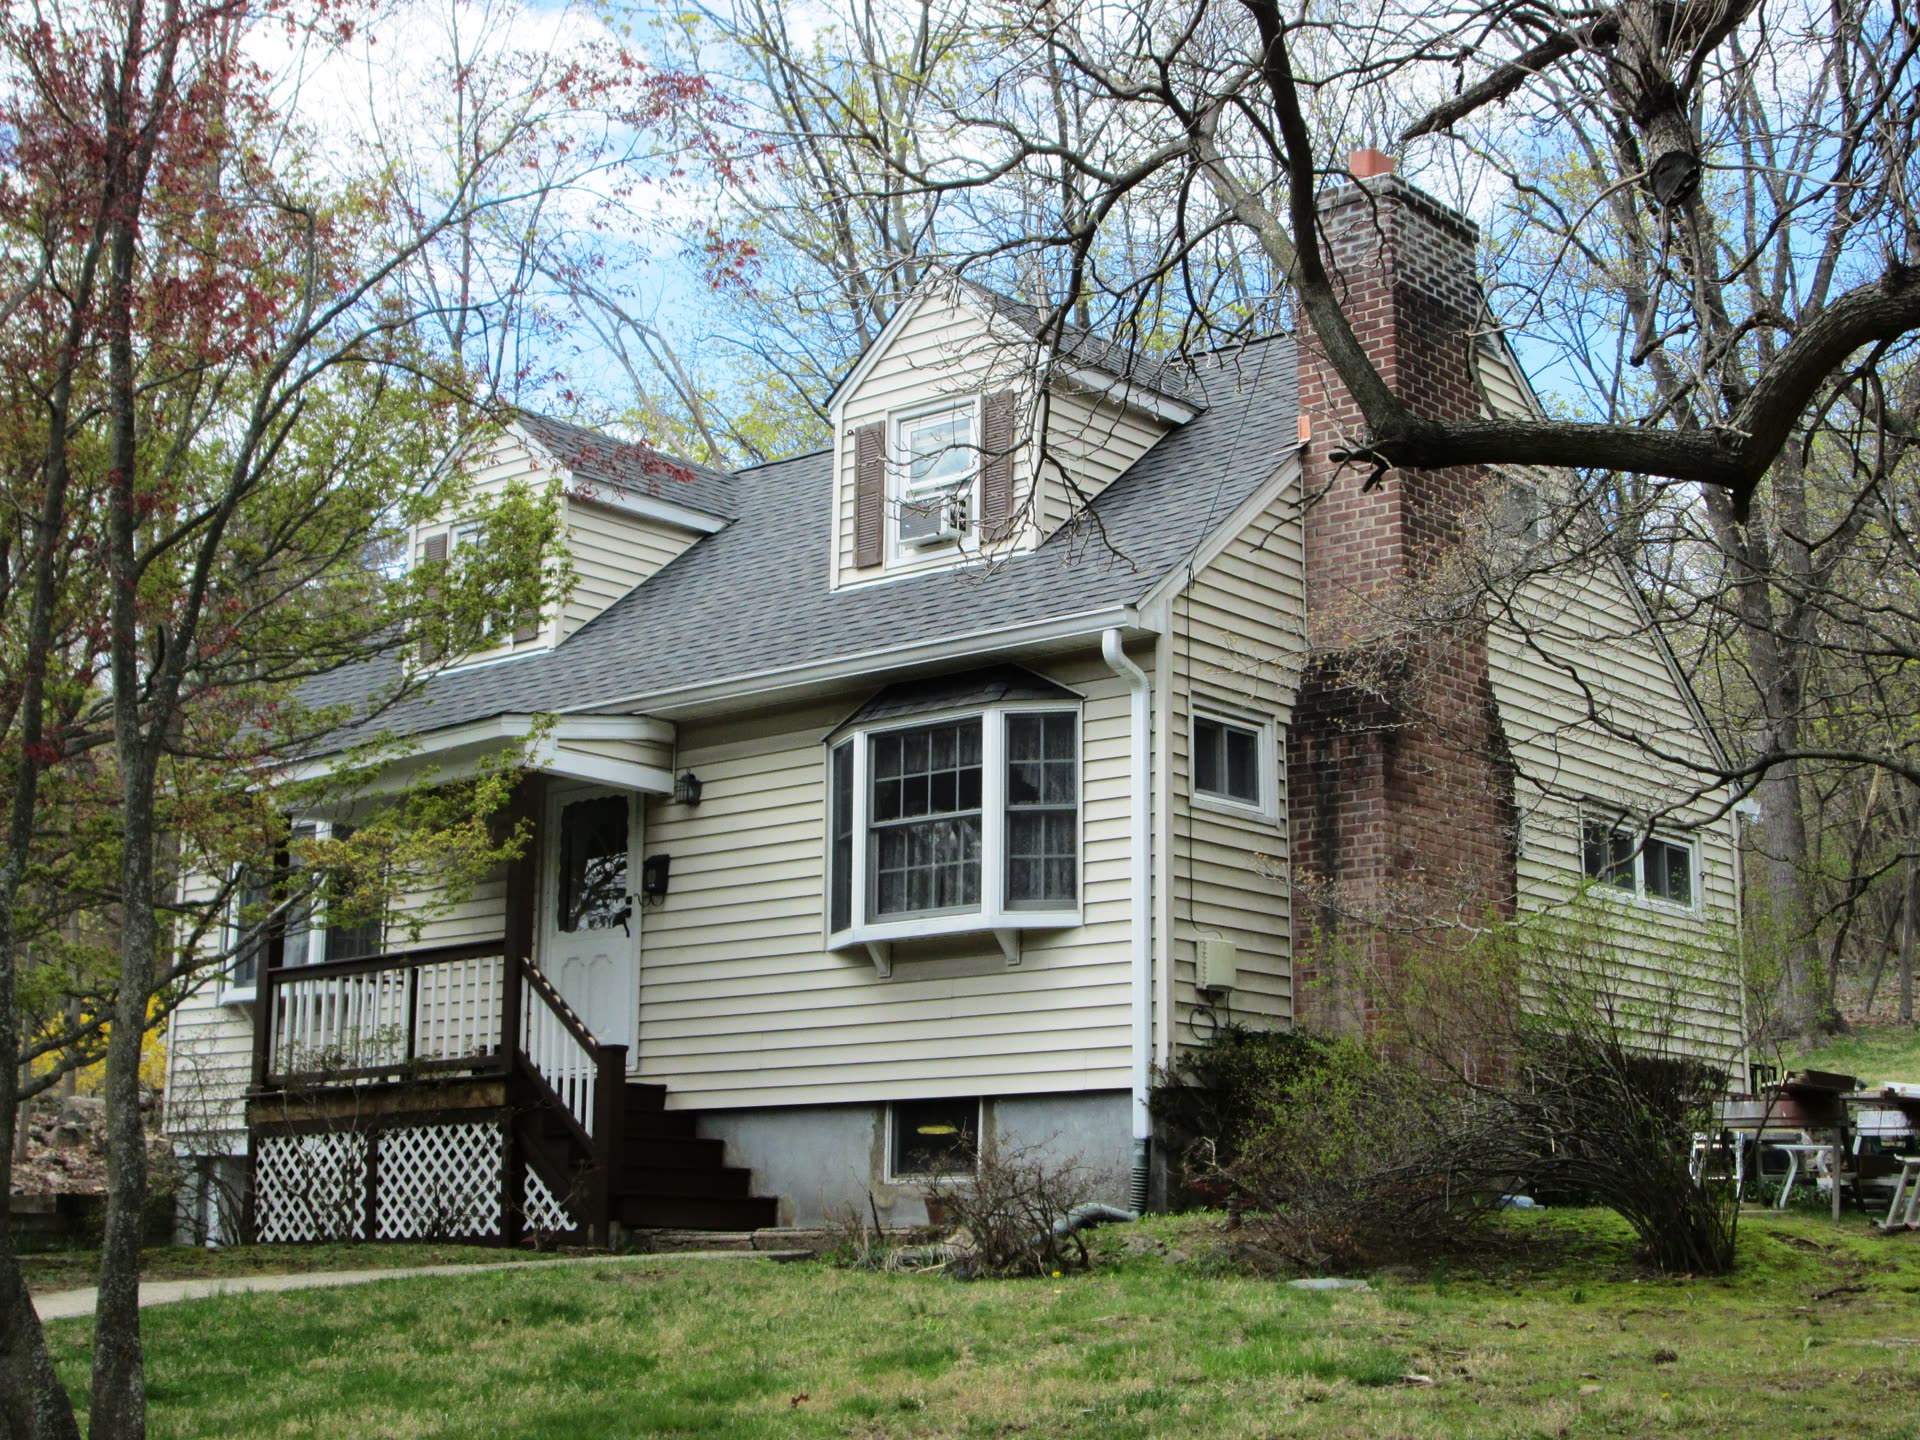
Westchester County is not the U.S. housing market with a different ZIP code. A national median, and even a single countywide median, compresses markets that do not compete with one another. A Scarsdale sale, a Yonkers 1–4 family, a Hudson River village dwelling, and a north-county acreage property can close in the same month and still require different comparable sets. An appraisal has to match the competitive set — property type, legal interest, site utility, and micro-location — not a U.S. median and not a Westchester average.
This is an August 25, 2026 market briefing for attorneys, fiduciaries, and owners who need to read those numbers the way an appraiser does. It is educational, not a listing recap. Coverage of local residential work is described on the firm’s Westchester County appraisal page. A city-level companion is the August 24 snapshot of New Rochelle’s mixed-type medians.
Prices: Westchester Is Not the National Median
Published 2026 figures do not describe one Westchester price, and they do not describe one U.S. price. They describe different filters — single-family versus all housing types, closed sales versus listings, one month versus a trailing quarter. The figures below were checked on the source pages in August 2026. Where two sources disagree, the disagreement is usually mix, not a “true” number hiding behind the other.
- U.S. existing homes, July 2026 (NAR): The National Association of REALTORS® reported a median existing-home price of $434,100 in July 2026, up 2.0% from $425,700 a year earlier — the 37th consecutive month of year-over-year price increases. The single-family median was $440,300 (+1.9%). The Northeast median was $563,800, up 5.2% year over year. Source: NAR Existing-Home Sales, July 2026 (released August 11, 2026).
- Westchester single-family, July 2026 (OneKey / Hudson Gateway): OneKey® MLS figures published via the Hudson Gateway Association of REALTORS®, current as of August 7, 2026, put the July 2026 single-family median sales price at $1,258,000, up 9.4% from $1,150,000 in July 2025. Sellers received 107.9% of original list price on average. Trailing-twelve-month single-family median was $1,050,000 (+8.8%). Condo median in July was $622,500 (+17.5%); co-op median was $249,500 (+10.9%). Source: July 2026 Westchester County Market Report (OneKey / HGAR).
- Westchester single-family, July 2026 (William Pitt Sotheby’s): The brokerage’s county Market Tracker, filtered to single-family homes, showed a July 2026 median sales price of $1.3 million (+8.9% versus July 2025) and an average sales price of $1.6 million (+9.4%). Sale-to-asking price was 108%. Those figures sit next to the OneKey median, not against it — both are single-family filters for the same month, with small differences in how each shop counts a “single-family” closing. Source: William Pitt Sotheby’s Westchester Market Tracker.
- Westchester mixed-type, three months ending June 2026 (Redfin): Redfin’s county page reported a median sale price of $937,355 over the three months ending June 2026, up 6.8% year over year, with a median of $469 per square foot (+11.4%) and a 106.0% sale-to-list ratio. Redfin counted 806 homes sold in June 2026. That series mixes single-family, townhouse, and condo/co-op sales, which is why it prints well below the OneKey and William Pitt single-family medians. The live Redfin page blocked an automated fetch in August 2026; the figures are those published on Redfin’s Westchester County housing market page for June 2026.
- Westchester listing median, July 2026 (realtor.com / FRED): Realtor.com’s monthly Housing Inventory Core Metrics series, via FRED, put the Westchester median listing price at $739,000 in July 2026 (updated August 7, 2026), after $749,700 in June. A listing median that sits hundreds of thousands of dollars below closed single-family medians is a composition warning — condos, co-ops, and lower-priced actives versus closed detached sales — not evidence that “the market” is $739,000. Source: FRED MEDLISPRI36119 (Realtor.com).
- Westchester single-family, Q2 and first half 2026 (brokerage reports): Houlihan Lawrence, as reported by Westfair on July 13, 2026, counted 1,075 Westchester single-family sales in Q2 2026 (−7.8% from Q2 2025) with a median of $1,240,000 (+15.3%). Condo median was $575,000 on 341 sales; co-op median was $235,000 on 379 sales. Compass’s first-half 2026 county report, as summarized July 10, 2026, put the year-to-date single-family median at $1,100,000 (+15.8%) with unit sales down 10.5%. Those period medians are lower than the July monthly prints because they average winter and spring closings into the same number. Sources: Westfair / Houlihan Lawrence Q2 2026; Compass H1 2026 (as published).
Read together: the U.S. existing-home median in July was $434,100. Westchester single-family medians in the same month clustered near $1.26–$1.3 million. Mixed-type county medians in mid-2026 clustered closer to the mid-$900,000s. None of those numbers is “the Westchester price.” The gap versus the U.S. median is not a mystery of taste. Buildable lots in an already-developed county next to New York City are scarce; the housing stock mix is weighted toward detached dwellings and higher-value product that does not exist in the same proportions in the national sample; and proximity to NYC employment centers supports a different demand bid for the same physical house. That is land, stock, and labor-market geography — not a claim about who occupies the houses.
Inventory: Tighter in Single-Family, Looser in Some Other Product
National inventory in July was not expanding. NAR reported 1.54 million unsold existing homes at the end of July 2026, down 1.9% from June and down 0.6% from July 2025, equal to a 4.6-month supply — unchanged from the prior month and from a year earlier. Typical time on market was 29 days, up from 28 days in June and in July 2025. Existing-home sales ran at a 4.06 million seasonally adjusted annual rate. Source: NAR, July 2026.
Westchester does not publish a countywide months-of-supply figure on the same NAR definition that could be dropped next to that 4.6-month number. What the local sources do show is a split by property type, and the inventory counts disagree with one another for the same reason the prices do.
- OneKey single-family, July 2026: 899 homes for sale, down 9.3% from 991 in July 2025. New listings were 477 (+3.2%). Closed sales were 638 (+9.1%). Days on market until sale were 25, versus 24 a year earlier. Trailing-twelve-month inventory averaged 837 (−3.3%). Condo inventory was 282 (−4.4%). Co-op inventory was 500, up 16.8% — the one major product type that loosened. Source: OneKey / HGAR, data as of August 7, 2026.
- William Pitt, July 2026: Total monthly inventory of 3,523 units, up 21.0% from July 2025 and 39.0% from July 2024. That is an all-types count (single-family, condo, co-op, land, multi-family), not a single-family months-of-supply. Single-family units sold in July were 625 (+7.8%); new single-family listings were 441 (+20.5%); average days on market were 25. Source: William Pitt Market Tracker.
- Realtor.com Core Metrics, July 2026: Active listing count of 1,637 (single-family and condo/townhome, monthly average, excluding pending), after 1,671 in June. Source: FRED ACTLISCOU36119 (Realtor.com), updated August 7, 2026.
- Redfin mixed-type, June 2026: Median days on market of 21, unchanged from a year earlier; 65.1% of homes sold above list. Source: Redfin Westchester housing market.
Those inventory figures are not interchangeable. OneKey’s 899 is July single-family actives. Realtor.com’s 1,637 is a monthly average of single-family plus condo/townhome. William Pitt’s 3,523 is total units across every category the tracker includes. A live realtor.com market page can print a still different point-in-time count. The honest reading is: Westchester single-family inventory was tighter in July 2026 than a year earlier, even as some other product — especially co-ops — added listings, and even as one brokerage’s all-types count rose. Nationally, NAR’s existing-home inventory was slightly lower than a year earlier and sat at 4.6 months of supply. Westchester single-family is not “balanced” on that national ruler. It is also not a single countywide absorption rate.
What’s Driving It
The drivers that show up in the data are economic and physical. They are not a story about who lives where.
Mortgage rates versus 2020–21 lock-in. Freddie Mac’s Primary Mortgage Market Survey put the 30-year fixed-rate mortgage at 6.65% as of August 20, 2026, down from 6.67% the prior week and compared with 6.58% a year earlier. The 15-year averaged 5.95%. In the first week of January 2021, the same 30-year survey averaged 2.65% — the series low. An owner who originated or refinanced near that low still holds a payment that current market rates do not replace. FHFA Working Paper 24-03 estimated that for every percentage point market rates exceed the origination rate, the probability of sale falls 18.1%, and that lock-in prevented 1.33 million sales between 2022Q2 and 2023Q4. The mechanism still applies while the gap between outstanding coupons and the current 6.65% PMMS rate remains this wide. Sources: Freddie Mac PMMS, week of August 20, 2026; Freddie Mac, January 7, 2021; FHFA WP 24-03.
Owners not listing, especially in single-family stock. OneKey’s July single-family inventory was down 9.3% year over year even as closed sales rose 9.1%. That combination — fewer listings, more closings, 108% of list — is what lock-in plus rate-sensitive demand looks like on the ground. Co-op inventory moving the other way (+16.8%) is a reminder that the lock-in effect is mortgage- and product-specific, not a countywide mood.
Limited new single-family supply and replacement cost. U.S. Census building-permit data, via FRED, show Westchester authorized 996 new private housing units in 2025, down from 1,592 in 2024 and 3,454 in 2022. That series is all structure types (1-unit through 5-or-more). New construction is not replacing existing detached stock at a pace that would loosen the single-family competitive set. Where a cost approach is relevant, replacement cost has to be taken from current local contractor evidence, not from a national average. Source: Census / FRED BPPRIV036119 (updated May 28, 2026).
Insurance and tax load as carrying costs. Property tax is a documented carrying cost that affects marketability and the pool of financed buyers. Census ACS-based county figures commonly cited for Westchester put the median annual property-tax bill near $10,001 at a 1.51% effective rate against ACS home values — a different value basis from 2026 closed-sale medians, so the percentage should not be multiplied through a $1.26 million sale as if it were the tax bill. Flood-zone status on Hudson River and Long Island Sound parcels adds insurance cost and, on mortgaged properties, can be mandatory. Those items belong in the appraisal as marketability and cost, not as labels for the location. Source: PropertyTaxByState / Census ACS summary for Westchester.
Rate-sensitive demand, with NYC employment as a bid for housing. NAR’s July report noted that existing-home sales remain sensitive to the 30-year rate; the association’s chief economist said the market would be “thriving” if average rates returned near 6%. NYC Economic Development Corporation’s July 2026 snapshot (as of July 23, 2026) reported New York City private-sector jobs up 1.3% year over year versus 0.5% nationally, metro-area employment up 0.7% year over year (about +69,100 jobs), and Kastle metro office occupancy at 63.6% of a pre-pandemic baseline as of the four-week average ending July 15, 2026 — up 10.7 percentage points year over year, still well below 100%. Subway ridership was 80.1% of the June 2019 baseline. Hybrid office patterns have not restored a five-day occupancy baseline; they have restored enough in-office activity, and enough metro employment, to keep housing near regional transit infrastructure in the demand set. That is a labor-market and transportation fact, not a claim about who occupies the houses. Sources: NAR July 2026; NYC EDC Economic Snapshot, July 2026.
What This Means for Appraisal Work
The national numbers are useful as context. They are not a time adjustment, a listing-to-sale discount, or a value opinion.
- Time adjustments come from the competitive set. OneKey’s July single-family median was up 9.4% year over year; NAR’s U.S. median was up 2.0%. A pair of 2025 comps in the subject’s town cannot be “updated” with either of those percentages as a default. Paired sales or a local index built from matched property type and location still govern.
- Listing-to-sale is not a countywide concession rate. Single-family product in July closed at 107.9–108% of list on the OneKey and William Pitt prints. Co-ops closed at 98.5% of original list. Applying a single-family sale-to-list ratio to a co-op, or a U.S. 96% Redfin sale-to-original-list ratio to a Westchester detached dwelling, will bias the opinion.
- Bracket by town, not by county. Scarsdale, Yonkers, the river villages, and north county are not substitutes. A county median is a briefing statistic. If the comparable sales are not in the same competitive market as the subject, the county number will not salvage the analysis.
- Assessment is not market value. Westchester assessed value is a tax-roll figure. Grievance work compares that assessment to a current, supportable market-value opinion built from physical evidence and matched sales — not to a U.S. median, a listing median, or last year’s county average. Related background is on the firm’s tax grievance page.
A U.S. median is not a Westchester value opinion. Time adjustments, list-to-sale ratios, and comparable sets have to be built town by town and property type by property type. If the competitive set is wrong, no countywide or national average will repair the report.
Reading 2026 Market Stats in an Appraisal
- Identify the filter: single-family, condo, co-op, or mixed-type; monthly versus trailing quarter
- Do not import NAR’s 4.6-month U.S. supply or 2.0% price change as a Westchester time adjustment
- Treat listing medians that sit far below closed single-family medians as a mix problem
- Support sale-to-list and days-on-market from the subject’s property type, not the county blend
- Document carrying costs (tax, insurance, flood zone) as marketability — not as location labels
- Keep Metro-North and highway access in the site analysis as infrastructure, evidenced by competing sales
Final Thoughts
For attorneys, fiduciaries, and owners, the practical point is narrower than the headlines. Westchester sale prices in 2026 remain well above the U.S. existing-home median, with a larger year-over-year gain in local single-family prints than NAR reported nationally. Single-family inventory in the county was tighter than a year earlier; some other product loosened; the national existing-home inventory figure did not rise in July. Mortgage lock-in, limited new supply, carrying costs, and a still-rate-sensitive buyer pool are the documented drivers. NYC metro employment and a partial office return support demand for housing with regional transit access. They do not turn a county median into a value.
Whether the purpose is estate settlement, tax grievance support, divorce, financing, or a gift-tax valuation, a defensible Westchester appraisal is built from physical evidence and matched market data in the subject’s competitive set. It is not imported from a U.S. median, a countywide average, or a listing-price series that mixes property types.
Need an Appraisal in Westchester County?
Whether for estate planning, tax grievance, gift tax, or a mortgage transaction, we provide thorough, professional valuation services across Westchester and the tri-state area.
Get a Free Quote