
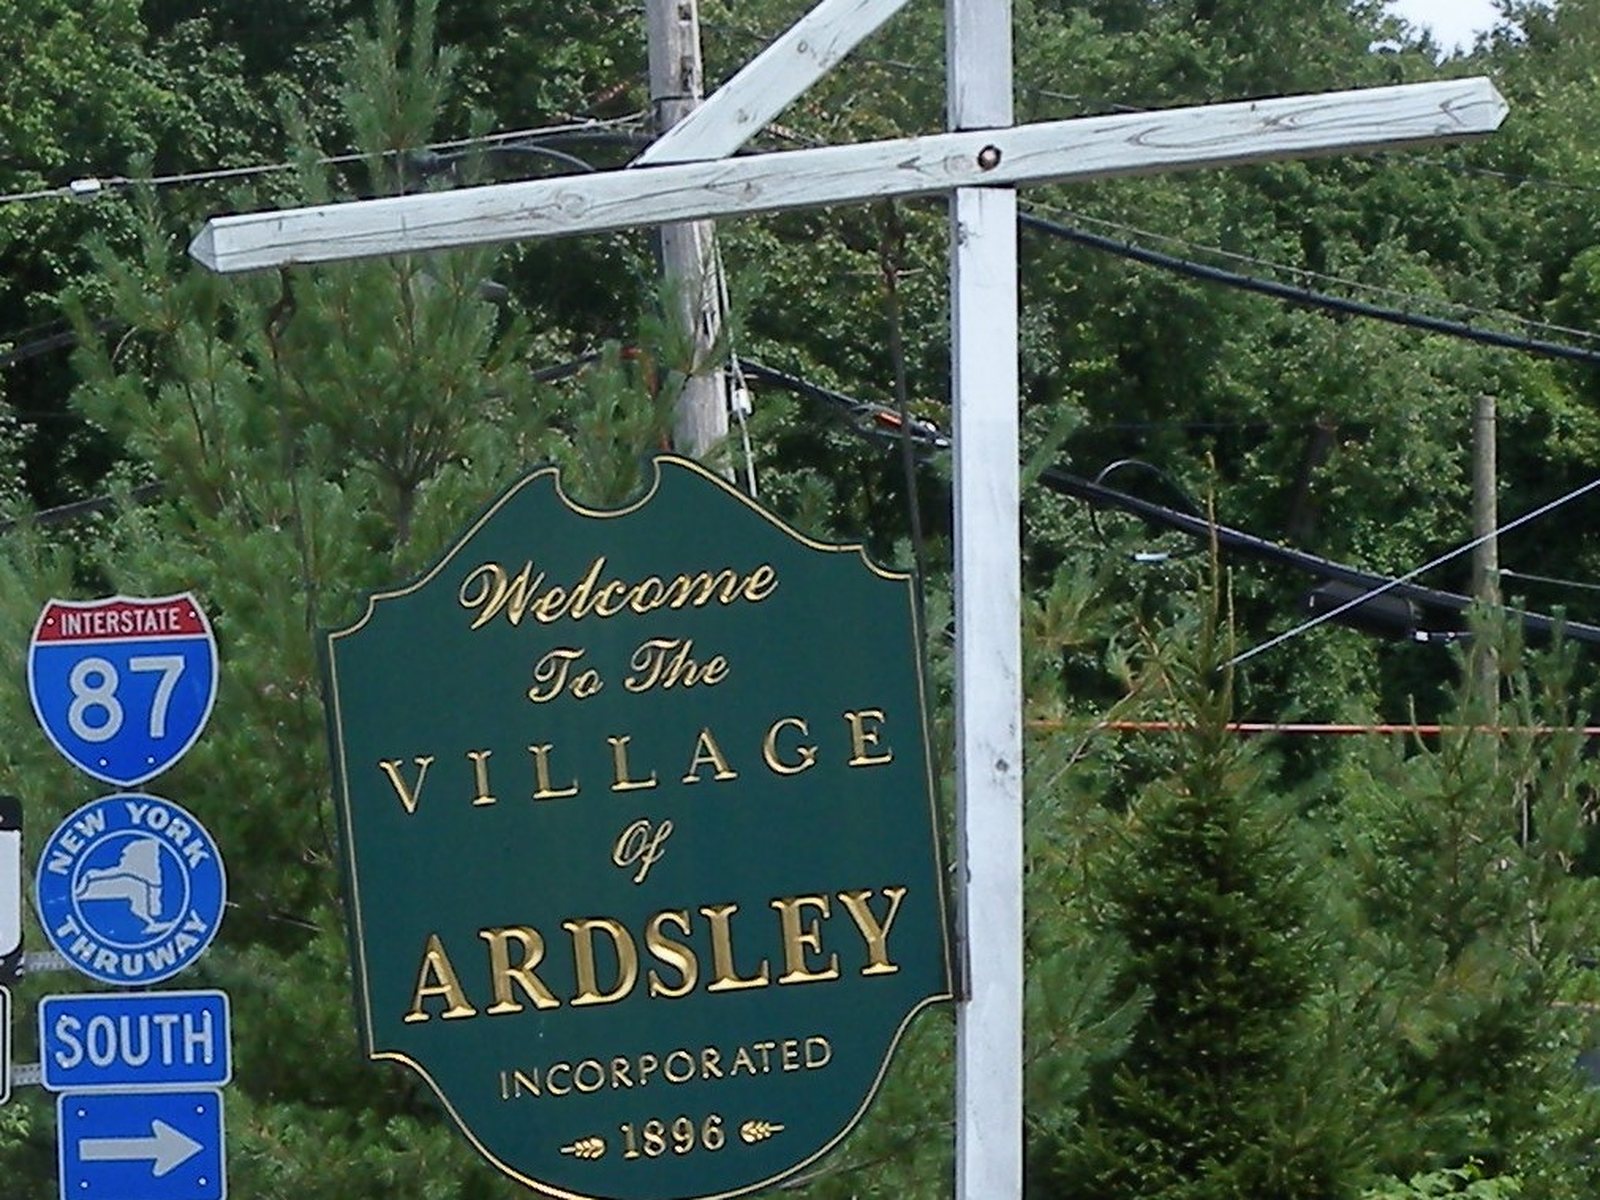
“Ardsley” on a market report is a reporting area, not a single legal boundary. The Village of Ardsley sits inside the Town of Greenburgh, and Ardsley mailing addresses and brokerage “Ardsley” cuts can also take in sections of unincorporated Greenburgh. Each data provider draws that line its own way, which is why three public series below report three different sales counts for the same year. An Ardsley median is a useful temperature check. It is not a value opinion for any one house. An appraisal still has to match the subject’s location, product type, gross living area, condition, lot size and utility, and the effective date.
This November 2026 Insights post reads the latest closed-sale statistics the way an appraiser does: price level, inventory, days on market (DOM), sale-to-list, and closed volume, with no lifestyle framing. It complements the methodology piece Appraising Homes in Ardsley, NY and does not replace a property-specific assignment. Local coverage is described on the firm’s Greenburgh appraisal page and the Westchester County appraiser hub.
Sources: Three public series are used below. The primary is the Houlihan Lawrence Ardsley Single Family Monthly Market Report for October 2026 (OneKey MLS). The second is the William Pitt Sotheby’s Ardsley Market Tracker for October 2026. The third is the Homix OneKey-based Ardsley report for October 2026 (data as of November 8, 2026), used here for its trailing 12-month series. Different filters produce different counts. That is expected. Appraisers reconcile competing series by reading the filter first, then the number, and by verifying current MLS closed sales for the assignment’s effective date.
October 2026: Ardsley Single-Family Snapshot
Houlihan Lawrence’s Ardsley single-family table for October 2026 shows:
- Median sale price: $1,229,000 (+0.3% versus September 2026; +24.1% versus October 2025)
- Average sale price: $1,224,226 (−9.0% MoM; +22.9% YoY)
- Units sold: 8 (−33.3% MoM; +166.7% YoY)
- Average DOM: 32 days (+60.0% MoM; +88.2% YoY)
- Sale-to-list (% of sales price): 105.62% (−3.6% MoM; −0.8% YoY)
- Units for sale: 12 (−14.3% MoM; +100.0% YoY)
- Months of inventory: 1.50 (+25.0% MoM; −25.0% YoY)
Year-to-date context from the same report’s ten-year table (through October 31, 2026): the 2026 YTD median sold price is listed as $1,216,000, about 10.5% above the 2025 full-year median of $1,100,000 on that table. The 2025 figure was itself a 27% jump over 2024’s $865,000. For scale, the table shows a $700,000 median in 2017, so the 2026 YTD median is roughly 74% higher. The same table lists 87 single-family sales for 2026 year to date, against 83 for all of 2025 and 79 in 2024.
| Metric (Ardsley SF, HL / OneKey) | Oct 2026 | vs Sep 2026 | vs Oct 2025 |
|---|---|---|---|
| Median sale price | $1,229,000 | +0.3% | +24.1% |
| Average sale price | $1,224,226 | −9.0% | +22.9% |
| Units sold | 8 | −33.3% | +166.7% |
| Average DOM | 32 days | +60.0% | +88.2% |
| Sale-to-list | 105.62% | −3.6% | −0.8% |
| Units for sale | 12 | −14.3% | +100.0% |
| Months of inventory | 1.50 | +25.0% | −25.0% |
Source: Houlihan Lawrence Ardsley Single Family Monthly Market Report, October 2026 (OneKey MLS). Figures deemed reliable but not guaranteed; not a value opinion for any subject property.
In Ardsley, October 2026 closed eight single-family sales at a $1.229 million median, about 105.6% of list price, with a 32-day average DOM. Twelve homes for sale works out to roughly 1.5 months of supply, which is still seller’s-market territory even though the count of listings doubled from a year ago. Those facts describe market conditions. They do not price any one house.
William Pitt Tracker: Same Month, Different Filter
William Pitt Sotheby’s Ardsley Market Tracker for October 2026 uses its own Ardsley boundary. It agrees with Houlihan Lawrence on the headline and adds a price-per-square-foot read:
- Units sold (October, SF): 9 (+200.0% YoY; +200.0% versus October 2024)
- Median sold: about $1.2 million (+21.2% YoY; +23.5% versus October 2024); average: about $1.2 million (+16.5% YoY; +5.7% versus October 2024)
- Average DOM: 34 (+97.4% YoY; +114.2% versus October 2024); percentage of asking: 105% (−1.6% YoY; +1.6% versus October 2024)
- Average $/SF: $525 (−1.2% YoY; −1.4% versus October 2024)
- New SF listings (October): 7 (0.0% YoY; +16.7% versus October 2024)
- YTD SF sold (January–October): 77 (+5.5% versus YTD 2025)
- Other product types, YTD: 11 condo/co-op sales (−8.3% versus YTD 2025) and 5 land sales (+25.0%)
- Total monthly inventory (all product types): 34 units (+36.0% YoY; +54.5% versus October 2024)
Source: William Pitt Sotheby’s Ardsley Market Tracker (October 2026). Brokerage dashboard figures are deemed reliable but not guaranteed.
The number that matters most here is price per square foot. William Pitt’s October median rose 21.2% year over year, but its average $/SF slipped 1.2%. When the median jumps and $/SF is flat, the jump came mostly from which homes sold (larger houses this October), not from the same house being worth 20% more. October 2025 was also an unusually thin comparison month, with three or fewer closings depending on the series, which inflates every year-over-year percentage in both brokerage reports.
Homix 12-Month Series: The Calmer Picture
Homix’s OneKey-based Ardsley report covers October 2026 (data as of November 8, 2026). Its single-month figures are very small (four closings at a $1,274,000 median, down 0.8% from October 2025), so the trailing 12-month columns are the part worth reading:
| Metric (Homix, Ardsley SF) | 12 mo. thru Oct 2025 | 12 mo. thru Oct 2026 | Change |
|---|---|---|---|
| Closed sales | 66 | 52 | −21.2% |
| Median sale price | $1,125,500 | $1,200,000 | +6.6% |
| % of original list | 106.6% | 110.6% | +3.8% |
| Average DOM | 26 | 22 | −15.4% |
| New listings | 71 | 64 | −9.9% |
| Average homes for sale | 8 | 7 | −12.5% |
Source: Homix Ardsley market report, October 2026, calculated from OneKey MLS data. Homix also reports about 1.6 months of supply, 83% of sales closing above original list over 12 months, and the $1M–$1.5M band accounting for 54% of sales.
On the trailing year, Ardsley’s median is up a moderate 6.6%, and sales closed at about 110.6% of original list price. That is a stronger sale-to-list figure than any single October number, because it measures against original list, not final list. Notice the volume gap too: Homix counts 52 closings over 12 months, while Houlihan Lawrence lists 87 for 2026 year to date and William Pitt counts 77. That is the boundary question from the top of this post showing up in the data. A narrower Ardsley cut and a wider one can move in opposite directions on volume while agreeing on price.
Why Ardsley Headlines Mislead
- Year-over-year volume is a base effect: “+166.7%” and “+200%” closings sound dramatic, but they compare eight or nine sales to roughly three. The year-to-date counts (HL 87 versus 83 for all of 2025; WP +5.5%) say volume is roughly steady, not booming.
- The median moved; $/SF did not: A 21% to 24% median gain alongside a 1.2% $/SF decline is a mix shift. Quoting the October median as the year’s appreciation rate overstates it. The trailing 12-month median (+6.6% on Homix) and the YTD median (+10.5% on HL) are closer to the trend.
- Inventory doubled, supply still tight: HL shows 12 homes for sale against 6 a year ago, yet months of supply fell to 1.5 because closings rose faster. Read the denominator before quoting “supply.”
- Longer DOM is relative: A 32-to-34-day average is nearly double October 2025, but it is still short by any regional standard, and sale-to-list stayed near 105%.
For a deeper primer on how appraisers parse medians, months of supply, DOM, and sale-to-list, see Market Conditions and How Appraisers Analyze the Stats. For a nearby comparison on a larger sample, see the Scarsdale housing market 2026 update.
How Appraisers Read Ardsley’s Competitive Sets
Market-conditions commentary in an Ardsley appraisal is built from the sales that actually compete with the subject, not from the area headline alone.
- Confirm the location first: Village of Ardsley or an unincorporated Greenburgh section with an Ardsley address. Taxing jurisdiction and municipal services can differ, so pull comps inside the matching set before expanding to neighboring Dobbs Ferry, Hastings-on-Hudson, Irvington, or Hartsdale sales.
- Bracket size with $/SF: With the $1M–$1.5M band carrying more than half of trailing-year sales, most Ardsley comps cluster tightly on price. Gross living area and $/SF separate them more reliably than the median does.
- Location influences are measured, not assumed: Frontage on or proximity to the Saw Mill River Parkway and the Thruway corridor is analyzed with paired sales where the data supports it. See how proximity factors are tested in Westchester.
- Time adjustments from the matched set: With the October median up about 24% and the trailing year up about 7%, a supported time adjustment comes from paired and repeat sales in the subject’s band, not from the monthly headline.
- Condo and co-op product is separate: Eleven condo/co-op sales year to date (WP) are not a basis for a detached single-family conclusion, and vice versa.
- Assessment versus market value: Assessed value is not market value. Tax-grievance work compares the assessment to a current, supportable market-value opinion. See tax grievance appraisals.
Estate, Date-of-Death, and Divorce Files When the Month and the Year Disagree
When the October median says +24% and $/SF says roughly flat, AVM estimates and area averages are least reliable, and the effective date carries more weight. For files that must stand up for counsel or a fiduciary:
- Estate / date-of-death: A retrospective opinion for Form 706, the New York estate tax return, probate, or fiduciary accounting uses market evidence knowable as of the date of death. An executor who quotes an October 2026 median for a winter 2026 date of death is mixing effective dates, and on an eight-sale month the error can be large in either direction. See estate appraisal, date-of-death appraisal, and date of death vs current market value.
- Divorce / equitable distribution: Current or retrospective (including date-of-commencement) valuations of the marital residence. When one spouse cites a 24% year-over-year median and the other cites flat $/SF, the effective date and the matched set decide the number, not either headline. See divorce appraisal and date-of-commencement appraisals in NY divorce.
- Attorney and fiduciary briefing: Counsel often need a plain-English read of whether a proposed buyout or listing price is consistent with recent matched sales, not with the area median or an AVM alone. Private USPAP reports differ from lender forms. See private vs lender appraisals and the firm’s attorney resources.
What Helps an Ardsley Market-Conditions Read
- Confirm Village of Ardsley vs unincorporated Greenburgh, and whether each data filter matches that area
- Pull closed MLS sales that match the subject’s location, GLA band, condition, and lot size and utility
- Record list price, original list price, sale price, concessions, and DOM for each competing sale
- Check $/SF alongside the median to separate mix shift from price change
- Note active and pending inventory inside the subject’s price and quality band, not only the area total
- Use trailing 12-month data, not a single month, before supporting any time adjustment
- Keep detached single-family, condo, and co-op sales in separate data sets
Final Thoughts
As of the October 2026 Houlihan Lawrence Ardsley single-family report, Ardsley’s market is firm on price and sale-to-list with steady year-to-date volume. The report shows a $1,229,000 median on eight closings, sale-to-list near 105.6%, a 32-day average DOM, and about 1.5 months of inventory. William Pitt’s tracker backs up the price, DOM, and sale-to-list figures, and its 1.2% $/SF decline plus Homix’s 6.6% trailing-12-month median are a reminder that one month’s 24% median gain is mostly a change in which homes sold. Those facts describe market conditions. They do not price any one house.
A defensible Ardsley appraisal still starts with physical evidence and matched sales from the right side of the village line. That set is then placed against the area statistics as context. Whether the purpose is estate settlement, divorce, tax grievance, or a private purchase opinion, Madison & Park builds the analysis that way across Westchester, Manhattan, and Greenwich CT. Dave Lister, SRA, is a New York certified residential appraiser and is Licensed in Connecticut; Court Approved status applies in New York only.
Hero photo: Ardsley welcome sign, by Jim.henderson, via Wikimedia Commons, released under CC0; cropped and resized.
Need an Appraisal in Ardsley?
Whether for estate planning, divorce, tax grievance, or a private market opinion, we provide thorough, professional valuation services across Westchester, Manhattan, and Greenwich CT.
Get a Free Quote