
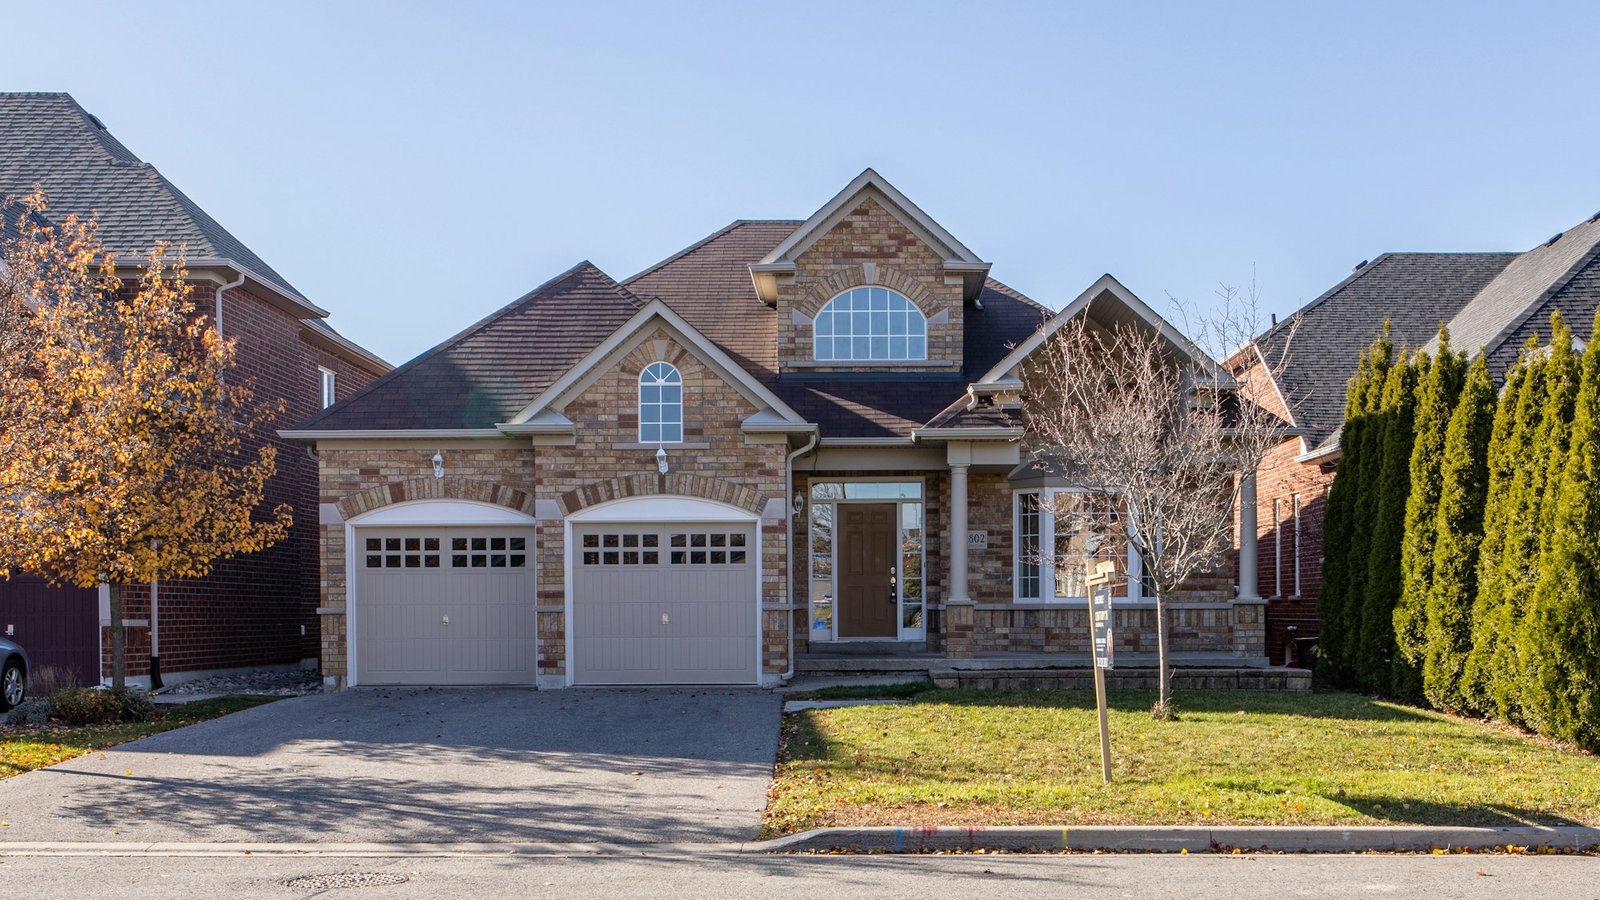
“Pelham” is not one competitive pool. The Town of Pelham includes two distinct incorporated villages — Pelham Village and Pelham Manor — with different street grids, lot patterns, and housing-stock mixes. Published market dashboards often blend those villages (and sometimes adjacent New Rochelle or Eastchester marketing labels) into a single median. That blended figure is a useful temperature check. It is not a value opinion for any one house. An appraisal has to match the subject’s product type, condition, lot utility, and micro-location inside the right village competitive set.
This September 2026 Insights post reads the latest public mid-year and August snapshots the way an appraiser does: price level, inventory, days on market (DOM), sale-to-list (percentage of asking), and closed volume — without lifestyle framing. It complements the methodology piece Appraising Homes in Pelham, NY and does not replace a property-specific assignment. Local residential coverage is described on the firm’s Pelham appraisal page.
Sources: Figures below are attributed to named public brokerage and local market pages checked in September 2026. Different filters (single-family only versus mixed product; village versus zip versus broader marketing catchment; end-of-month active versus monthly inventory tables) produce different counts. That is expected. Appraisers reconcile competing series by reading the filter first, then the number — and by verifying current OneKey / MLS closed sales for the assignment’s effective date.
What the Mid-2026 and August Numbers Show
William Pitt Sotheby’s International Realty publishes a Pelham market report that can be read with a single-family filter. For August 2026 that report showed:
- Median sold price (single-family): $1.7 million (−16.0% versus August 2025; −25.3% versus August 2024)
- Average sold price (single-family): $1.7 million (−9.9% versus August 2025)
- Units sold (August, single-family): 12 (−33.3% versus August 2025)
- Average days on market: 23 (−17.4% versus August 2025)
- Percentage of asking price: 105% (+2.2% versus August 2025)
- Average price per square foot: $575 (−1.0% versus August 2025)
- New single-family listings (August): 1 (−66.7% versus August 2025)
- Year-to-date single-family homes sold: 70 (−1.4% versus YTD 2025)
- Total monthly inventory (all product types in the table): 34 units (−12.8% versus August 2025; +54.5% versus August 2024)
Source: William Pitt Sotheby’s Pelham market report (August 2026). Information on brokerage dashboards is deemed reliable but not guaranteed; MLS extracts and date stamps can differ slightly across republished agent pages. Marketing catchments on public dashboards are not identical to municipal boundaries — Village versus Manor still have to be separated in the file.
A separate public snapshot for ZIP 10803 (commonly associated with Pelham Manor marketing pages) showed a mid-2026 median sold price near $1.73 million, roughly 19 active listings, median days on market around 30, and sale-to-list near asking in recent monthly reads — another thin-inventory signal, but a different filter than the William Pitt “Pelham” dashboard. Source: realtor.com — 10803 housing market data (figures checked September 2026; dashboards refresh continuously).
Those series are not contradictions to average away. A blended “Pelham” August single-family median of $1.7 million, a ZIP-level sold median near $1.73 million, and a sale-to-list reading around 105% all describe a market where a handful of closings can move the monthly median — and where Village and Manor products are not automatic substitutes. For appraisal work, what matters is the shared direction: limited interchangeable supply relative to demand in many bands, short-to-moderate DOM when a well-matched dwelling is priced to the set, and sale prices frequently at or above asking inside the competing band.
| Metric (public snapshots) | Reading |
|---|---|
| Price level | Aug WP SF median/avg ~$1.7M; 10803 sold median ~$1.73M |
| Inventory | 34 total units Aug WP table (−13% YoY); ~19 active in 10803 snapshot |
| DOM | 23 days Aug WP SF avg; ~30 days median in 10803 read |
| Sale-to-list | 105% Aug WP SF; near asking in recent 10803 monthly notes |
| Volume | Aug SF units sold: 12; YTD SF sold 70 (≈ flat YoY in WP) |
Table summarizes attributed public pages above — not an MLS extract and not a value opinion for any subject property. Appraisers verify current OneKey / MLS closed sales for the effective date.
In Pelham, strong and soft are read from price level, inventory, DOM, sale-to-list, and volume — not from a Town-wide median applied across Village and Manor. If the comps do not attract the same purchaser on size, condition, lot utility, and village section, the multimillion-dollar headline will not salvage the analysis.
Why Town and ZIP Medians Mislead
A $1.7 million August single-family median is a useful headline. It is a poor substitute for matched sales. Common failure modes:
- Pelham Village versus Pelham Manor: The two villages share a town label and often share marketing pages. They do not automatically share a competitive set. Lot size, street section, renovation level, and product type still have to be matched. A Manor sale does not automatically support a Village subject — or the reverse — without location support from market evidence.
- ZIP and marketing catchment versus municipal boundary: ZIP 10803 and brokerage “Pelham” dashboards are not identical to either village boundary. Cross-municipal comps (New Rochelle, Eastchester, Mount Vernon edges) need explicit location support — not a shared postal or marketing label.
- Era and quality tier: Period Colonials and Tudors, mid-century stock, and later rebuilds of similar living area are different products. A full-gut renovation sale does not automatically support an unrenovated dwelling of similar GLA.
- Sale-to-list is not a blanket premium: A 105% average percentage of asking (William Pitt, August 2026) describes closed single-family outcomes that month. It does not mean every listing will clear at a fixed markup. Overpriced outliers still linger; underpriced, well-presented homes still compress DOM.
- Volume versus price: Twelve single-family closings in the August William Pitt snapshot alongside a still-elevated median is a classic thin-market pattern: fewer interchangeable substitutes, wider month-to-month median swings, and more bidding pressure when a well-matched house comes up. Year-over-year median declines in a thin sample can reflect mix shift (which properties closed) as much as a broad price reset — another reason matched comps beat the headline.
- Condo/co-op versus fee-simple: Condo and co-op interests that appear in mixed inventory tables are not interchangeable with detached fee-simple comps. Mixing product types is how a town “average” gets misused in private-use files.
For a deeper primer on how appraisers parse medians, MSI, DOM, and sale-to-list, see Market Conditions and How Appraisers Analyze the Stats.
How Appraisers Read Pelham’s Competitive Sets
Market-conditions commentary in a Pelham appraisal is built from the sales that actually compete with the subject — not from the town headline alone.
- Confirm the village first: Identify whether the subject is in Pelham Village or Pelham Manor (or elsewhere under a Pelham marketing label), then pull comps inside that competitive set before expanding.
- Bracket condition and quality: Prefer sales that bracket the subject rather than one superior rebuild or one deferred-maintenance outlier.
- Time adjustments from the set: Short average DOM does not erase the need for supported time adjustments when the matched set spans several months.
- Inventory as absorption context: Thin active inventory supports seller-favorable negotiation patterns in many price bands, but the appraiser still documents list-to-sale behavior inside the subject’s band.
- Boundary discipline: Sales outside the relevant village boundary may be considered only when they truly compete — after location, tax, and marketability differences are supported.
- Assessment versus market value: Assessed value is not market value. Tax-grievance work compares the assessment to a current, supportable market-value opinion — see tax grievance and the firm’s Pelham tax grievance 2026 note.
Private-Use Assignments When Inventory Is This Thin
Thin inventory and sale-to-list premiums change the conversation for private appraisal work as much as for purchase financing. Zillow-style AVMs and mixed-type town averages do not substitute for matched comps when the file must stand up for counsel or a fiduciary:
- Estate / date-of-death: Retrospective opinions as of a specific effective date for Form 706, probate, or fiduciary accounting — using market evidence knowable as of that date. See estate / date-of-death and alternate valuation date practice.
- Divorce / equitable distribution: Current or retrospective (including date-of-commencement) valuations of the marital residence. Rapid list-to-contract cycles make dual-date and effective-date control especially important — see divorce appraisal and date-of-commencement appraisals in NY divorce.
- Attorney and fiduciary briefing: Counsel often need a plain-English read of whether a proposed buyout or listing strategy is consistent with recent matched sales — not with the town median or an AVM alone. Private USPAP reports differ from lender forms; see private vs lender appraisals.
What Helps a Pelham Market-Conditions Read
- Confirm Village vs Manor (and whether the dashboard filter matches the municipal boundary)
- Pull closed OneKey / MLS sales that match the subject’s section, GLA band, condition, and lot utility
- Record list price, sale price, concessions, and DOM for each competing sale
- Note active inventory inside the subject’s price and quality band — not only the town total
- Separate condo/co-op and multi-unit evidence from fee-simple single-family analysis
- Document improvement dates, permits, and major systems so quality ratings are supportable
Final Thoughts
As of the mid-2026 and August 2026 public snapshots, Pelham’s single-family market reads competitive on the five metrics that matter for appraisal commentary: elevated price levels relative to much of Westchester, inventory still tight versus longer-run norms in several series, short-to-moderate DOM, sale prices frequently at or above asking, and limited monthly closed volume that makes medians swing. Year-over-year median declines in thin samples need mixed-sale reading — not a one-number conclusion. Those facts describe market conditions. They do not price any one house.
A defensible Pelham appraisal still starts with physical evidence and matched sales inside the right village competitive set — then places that set against the town statistics as context. Whether the purpose is estate settlement, divorce, tax grievance, or a private purchase opinion, Madison & Park builds the analysis that way across Westchester, Manhattan, and Greenwich CT. Dave Lister, SRA, is a New York and Connecticut certified residential appraiser; Court Approved status applies in New York.
Need an Appraisal in Pelham?
Whether for estate planning, divorce, tax grievance, or a private market opinion, we provide thorough, professional valuation services across Westchester, Manhattan, and Greenwich CT.
Get a Free Quote